From Postprandial Muscle Biopsy to Druggable Node: a translational re-read of GSE231509
What 21 vastus lateralis biopsies can really tell a drug-discovery team — when the analytical depth matches the design quality.
Makhnovskii P. et al. Vastus lateralis transcriptional response to a mixed-meal tolerance test in healthy, obese, and type 2 diabetic men. Published 2023 (PMID 37545425). Data: GEO GSE231509 — paired pre/post-MMTT vastus lateralis biopsies in 7 healthy, 7 obese, and 7 obese + T2D subjects.
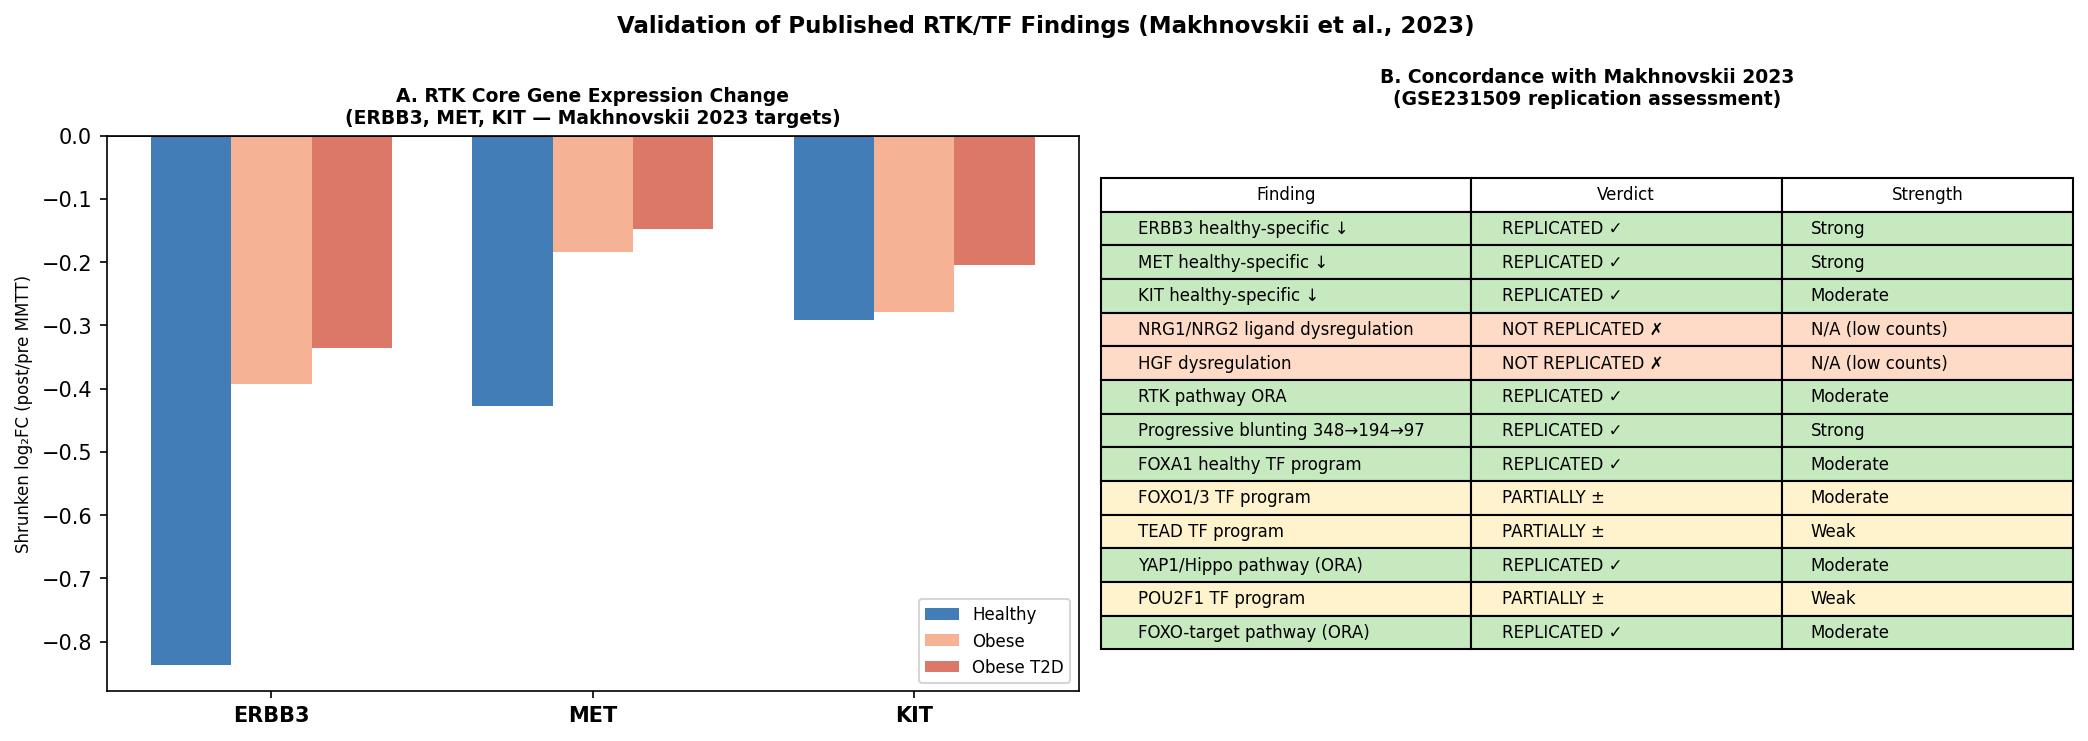
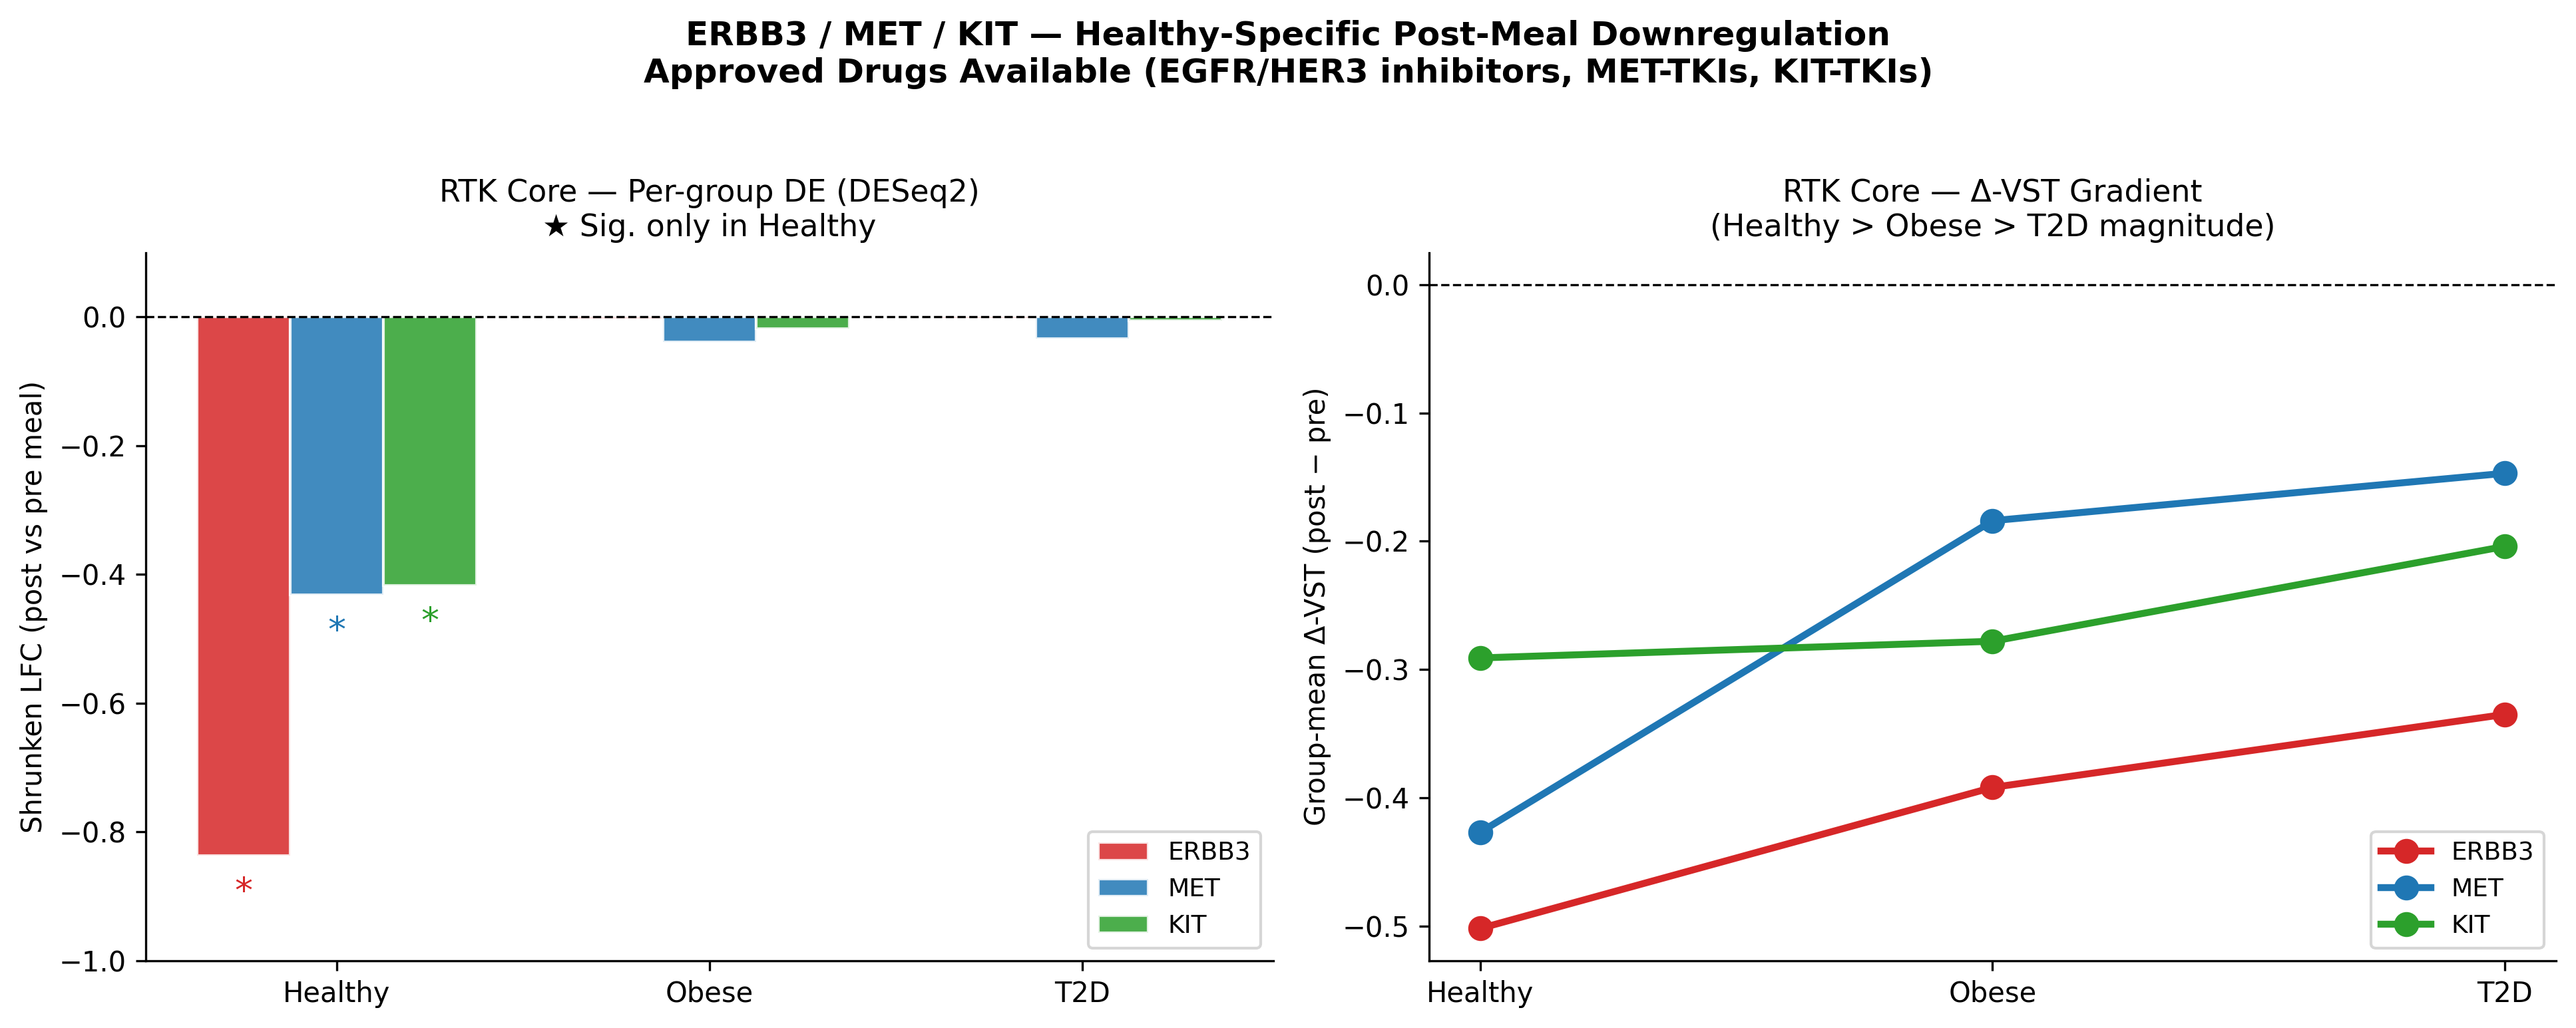
- The published RTK module replicates with strong statistics. ERBB3, MET, KIT are post-meal–suppressed only in healthy muscle (ERBB3 LFC −0.84, padj 3.7×10⁻⁴; MET LFC −0.43, padj 2.3×10⁻¹³; KIT LFC −0.42, padj 2.1×10⁻²) and the response is abolished in obese and T2D. Postprandial DEG counts compress 3.6× from healthy (348) → obese (194) → T2D (97).
- A graded metabolic divergence the original paper did not extract. OXPHOS amplification scales with disease (NES Healthy ~+1.3 → Obese +2.12 → T2D +2.57). T2D muscle shows unique anabolic reprogramming (MYC_TARGETS_V1 NES +2.14, REACTOME_TRANSLATION NES +2.10) plus BCAA-catabolism induction (NES +2.20) with simultaneously blunted IL-6/JAK-STAT3 (−2.05) and TNFα/NF-κB (−2.17) responses.
- Bulk-adapted ligand–receptor inference adds phenotype-differential axes. LIANA across 2,100 LR pairs surfaces NAMPT→P2RY6 and BMP5→BMPR1A (progressive blunting), DLL1→NOTCH1 (satellite-cell programme), PTN→PTPRS and LPL→VLDLR (T2D-specific gains). At the RTK family level, LRIG1→MET and SEMA4D→MET are the most differential axes.
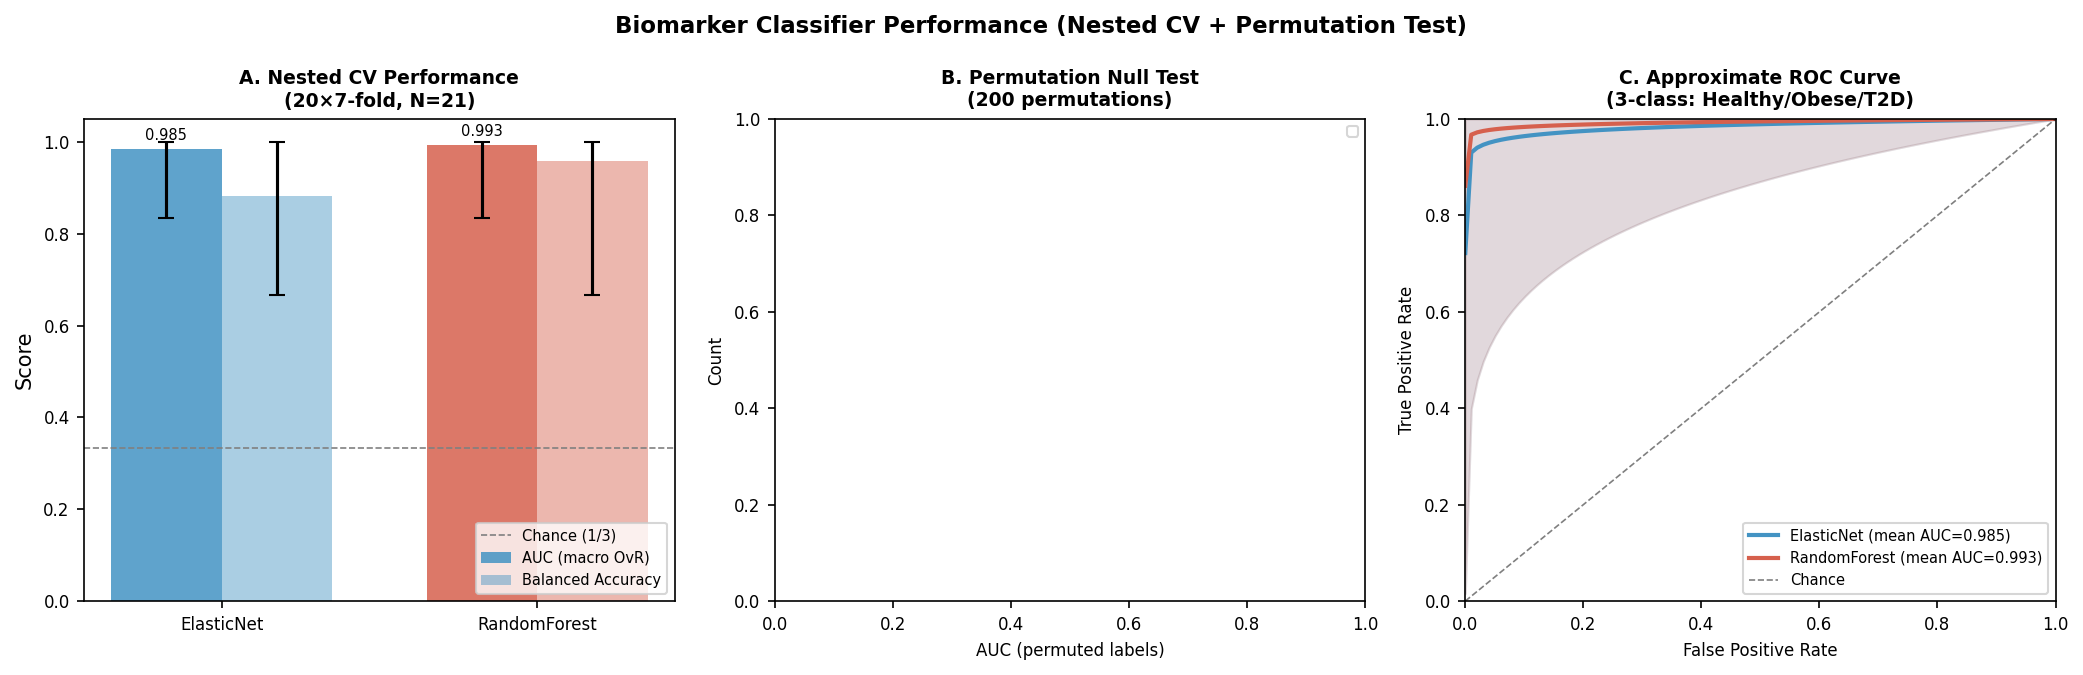
- Discovery-grade biomarker panel from two orthogonal streams. Nested-CV ElasticNet AUC 0.985 (95% CI 0.833–1.0) and RandomForest AUC 0.993, both with permutation p ≤ 0.005. A 12-feature cross-stream union panel anchored on MAPRE2, SGK1, BMPR1A, MECP2 and SOX6 (ρ = +0.884 with HbA1c, FDR 5×10⁻⁴).
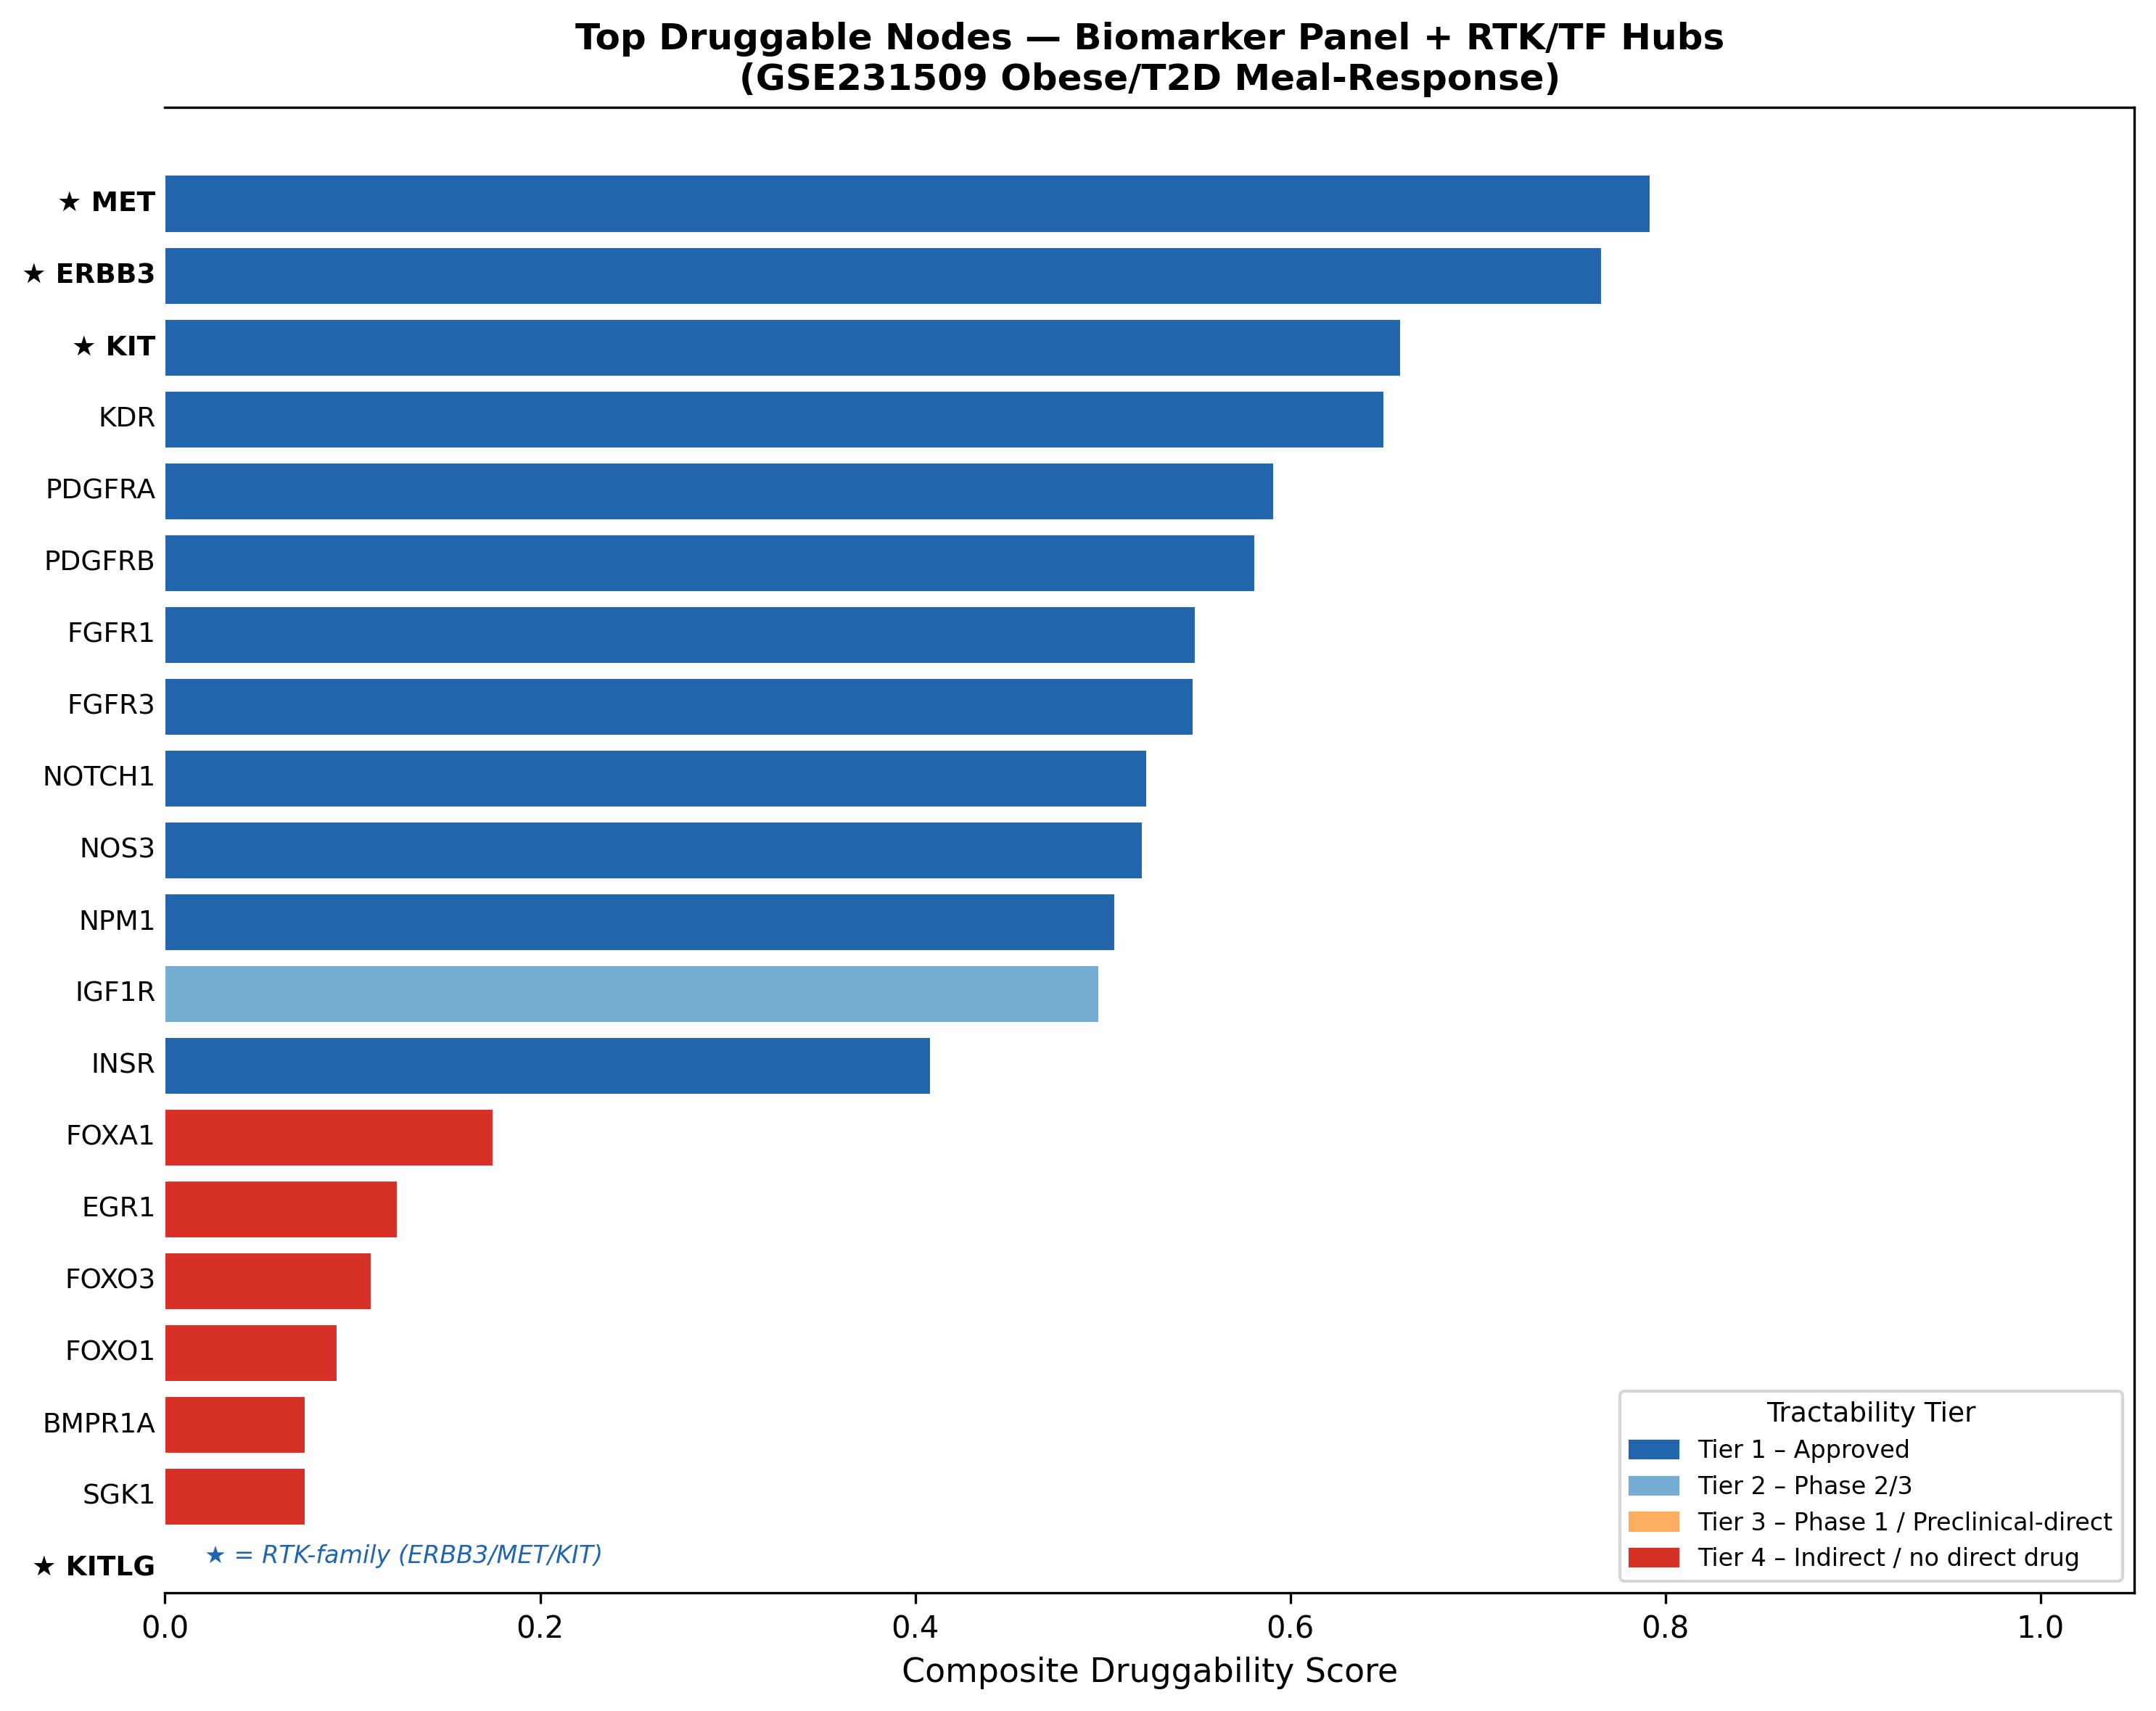
- Composite druggability ranking led by Tier-1 approved RTKs. MET 0.792 (Tepotinib/Capmatinib/Crizotinib/Cabozantinib, 13 DGIdb sources), ERBB3 0.766 (Pertuzumab/Seribantumab), KIT 0.659 (Imatinib/Avapritinib/Ripretinib), KDR 0.650 (Sorafenib).
- Honest translational caveats. N = 21; no genes survive FDR<0.10 in the formal interaction model; no LR pairs survive FDR<0.20; causal direction (inhibition vs agonism) is unresolved; ERBB3/MET/KIT carry no GWAS T2D risk-locus support; bulk RNA-seq misses cell-type provenance (NRG1 dropped at QC). Discovery-grade Phase-1 investment, not a clinical commitment.
Why revisit a 21-subject muscle RNA-seq study?
In 2023, Makhnovskii and colleagues published a beautifully designed paired study (GSE231509, PMID 37545425): vastus lateralis biopsies before and 1 hour after a mixed-meal tolerance test (MMTT) in 7 healthy, 7 obese, and 7 obese + T2D subjects. The headline finding was a receptor-tyrosine-kinase (RTK) module — ERBB3, MET, KIT — sharply suppressed after a meal in healthy muscle, and progressively unresponsive in obese and diabetic muscle. They also flagged a FOX/POU/Hippo transcription-factor programme.
Unusually clean paired design, but small N. A translational team looking at this paper would ask three questions: does the biology hold up under a modern, fully-traced reanalysis? What is the dataset not telling us that a richer pipeline could? And if we take the result seriously, what are the actionable, druggable nodes — and what is the realistic translational risk?
We rebuilt the entire analysis from raw counts using a paired DESeq2 + limma-voom pipeline, then layered on TF-activity inference (decoupleR / CollecTRI / DoRothEA), multi-collection GSEA, bulk-adapted ligand–receptor inference (LIANA, 2,100 LR pairs), Spearman clinical correlation against six metabolic traits, ensemble classifier-based stability selection (ElasticNet + RandomForest, nested CV), and a composite druggability score against DGIdb / ChEMBL / Open Targets.
The summary upfront: the original biology replicates, and the dataset has substantially more to give than was previously extracted — including a novel anabolic/inflammatory dichotomy in T2D, a discovery-grade biomarker shortlist, and a ranked list of druggable nodes led by MET (composite 0.792), ERBB3 (0.766), and KIT (0.659), all backed by approved Tier-1 drugs.
Step 1 — The original biology replicates with high fidelity
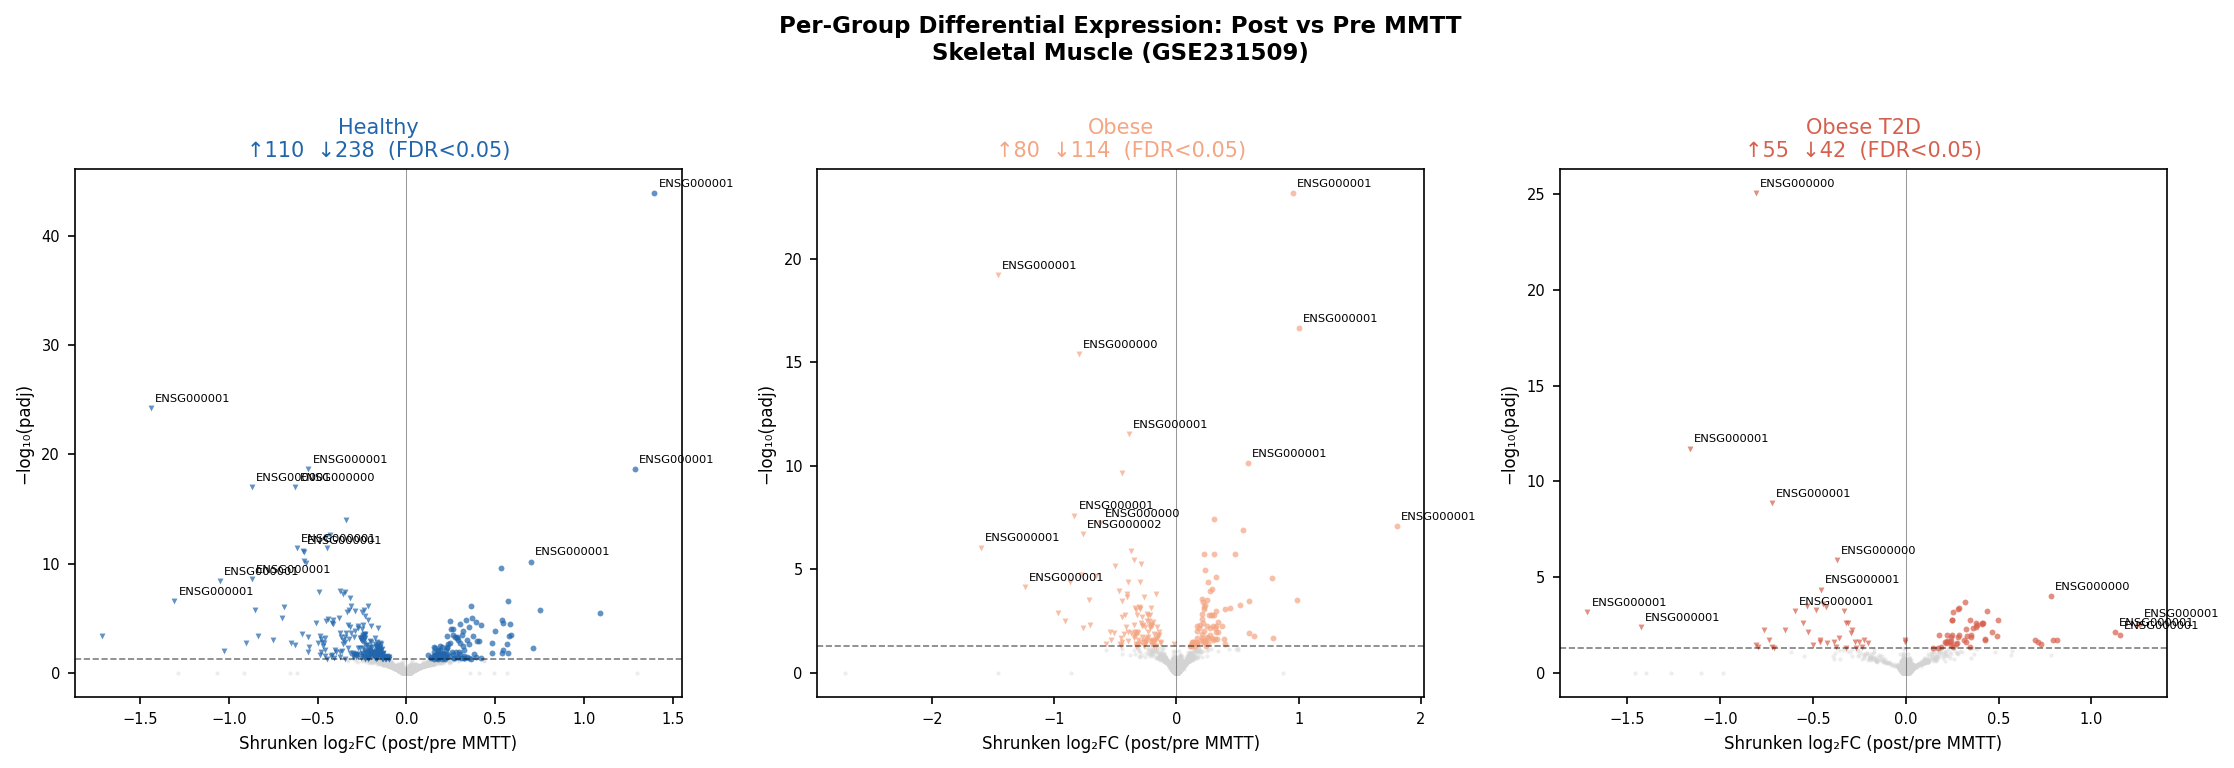
PC1 (15.9% of variance) cleanly separates Obese_T2D from Healthy/Obese, and intra-subject correlation (ρ = 0.684) confirms the paired design is real. The progressive blunting of the meal response is the first thing to fall out of the data:
| Group | Significant DEGs (FDR<0.05) | Up | Down |
|---|---|---|---|
| Healthy | 348 | 110 | 238 |
| Obese | 194 | 80 | 114 |
| Obese + T2D | 97 | 55 | 42 |
A 3.6× compression of the postprandial transcriptome from healthy to T2D — exactly the gradient Makhnovskii 2023 reported. The published RTK module replicates with strong statistics:
| Gene | LFC Healthy | padj Healthy | LFC Obese | LFC T2D |
|---|---|---|---|---|
| ERBB3 | −0.84 | 3.7×10⁻⁴ | −0.003 | −0.002 |
| MET | −0.43 | 2.3×10⁻¹³ | −0.039 | −0.034 |
| KIT | −0.42 | 2.1×10⁻² | −0.018 | −0.006 |
Healthy-specific suppression. Abolished in obese. Abolished in T2D. The ΔVST gradients confirm the magnitude (Healthy > Obese > T2D). The FOX/Hippo TF programme also recovers — FOXA1 is the only TF surviving BH correction (rbc = 0.394, padj = 4.5×10⁻³), with FOXO1/3 and POU2F1 partially confirmed.
The non-replicated pieces are also informative for drug developers: NRG1 dropped out at QC (low counts in muscle bulk), and HGF / NRG2 pass filtering but show near-zero LFC in all groups. The published "ligand" signal almost certainly reflects non-myofiber cell types that are diluted in bulk tissue — a clear flag for any decision-maker considering bulk vs single-nucleus work in this indication.
Verdict: PROCEED. The biology is real enough to extend.
Step 2 — What the original paper missed: a graded metabolic divergence
Multi-collection GSEA (Hallmark, KEGG, Reactome) reveals that the disease gradient is not just signalling-blunting — it is a coordinated metabolic re-wiring that amplifies with disease severity:
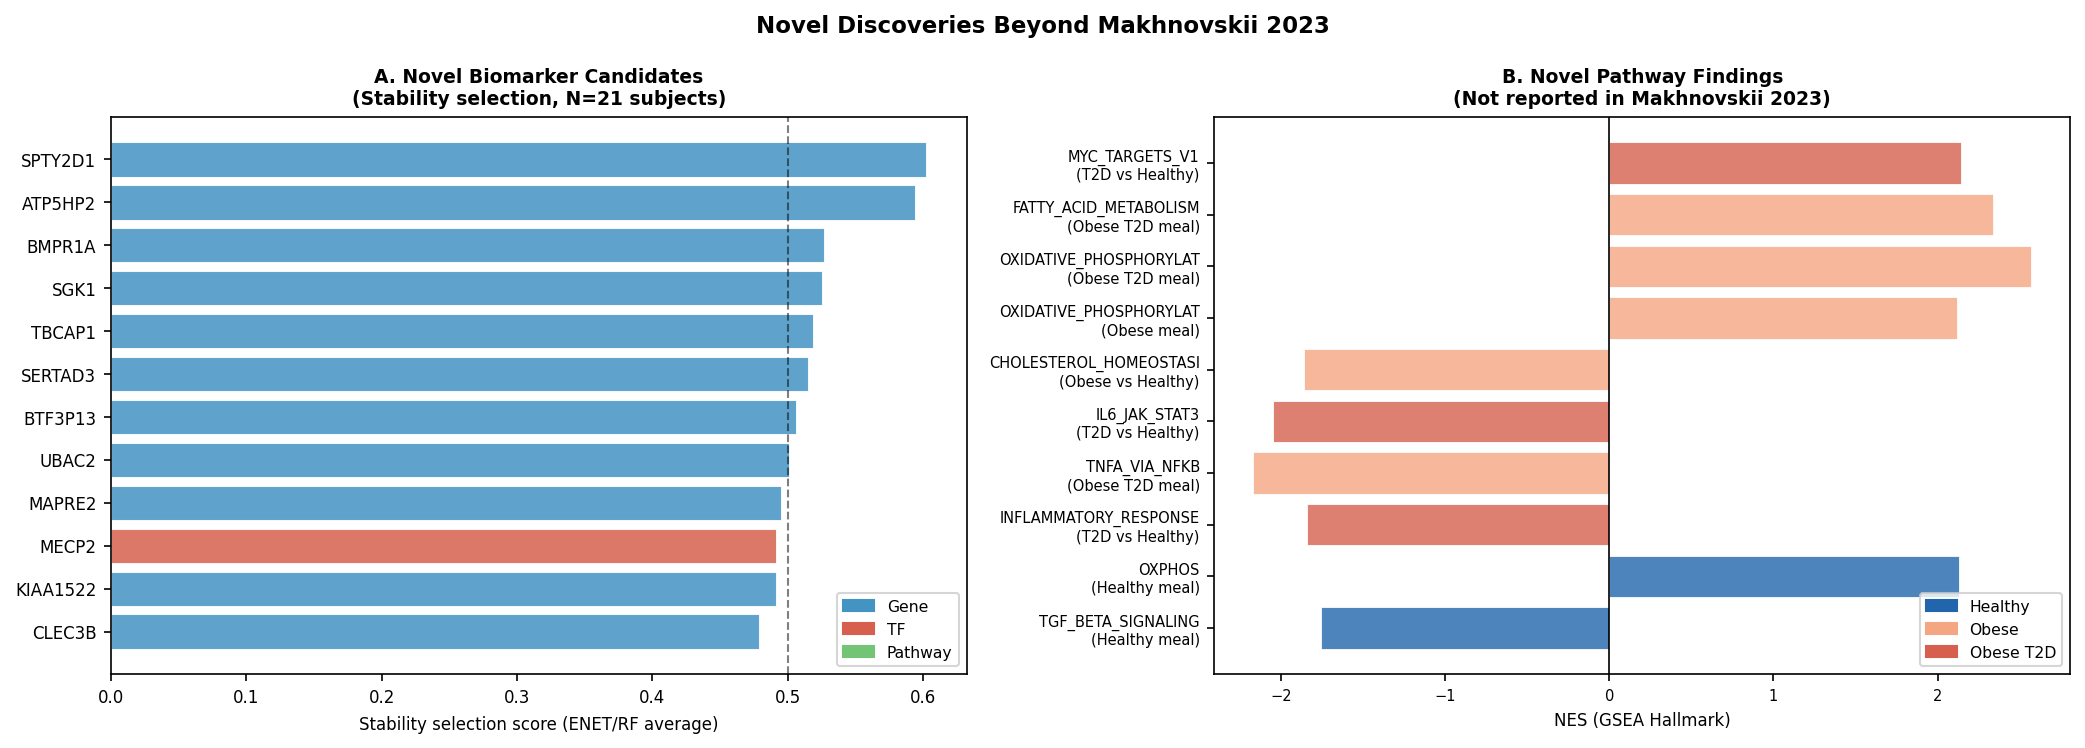
- OXPHOS amplification scales with disease: HALLMARK_OXIDATIVE_PHOSPHORYLATION NES Healthy ~+1.3 → Obese +2.12 (FDR 2.2×10⁻⁶) → T2D +2.57 (FDR 1.4×10⁻¹⁹). Counter-intuitive: T2D muscle is mounting the strongest mitochondrial transcriptional response post-meal.
- Obese-specific PPAR / fatty-acid amplification (NES +2.26, FDR 2.7×10⁻⁴) with blunted cholesterol homeostasis (NES −1.86, FDR 1.8×10⁻³) — a transcriptomic fingerprint of metabolic inflexibility.
- T2D-unique anabolic reprogramming: HALLMARK_MYC_TARGETS_V1 NES +2.14 (FDR 4.6×10⁻⁹), REACTOME_TRANSLATION NES +2.10 (FDR 9.2×10⁻¹²), KEGG_AMINOACYL_TRNA_BIOSYNTHESIS NES +1.90.
- T2D-unique BCAA catabolism induction (KEGG_VAL_LEU_ILE_DEGRADATION NES +2.20, FDR 1.3×10⁻⁵) — consistent with the well-established BCAA-disposal defect in T2D.
- Blunted inflammatory dynamic range in T2D: IL6_JAK_STAT3 NES −2.05, INFLAMMATORY_RESPONSE NES −1.84, TNFA_VIA_NFKB NES −2.17 — chronic baseline inflammation likely exhausts the acute response window.
This is the single most important addition to the original paper for a biopharma audience. T2D muscle is not "less responsive" — it is responsive in a different mode: anabolic translation, BCAA breakdown, and OXPHOS amplification with simultaneously suppressed acute cytokine induction. Each of those axes has its own therapeutic correlates.
Step 3 — Reading the regulatory wiring: TFs and ligand–receptor crosstalk
decoupleR-inferred TF activity (CollecTRI + DoRothEA, ΔVST per subject) extends the published FOX/POU programme. FOXA1 is the only TF that survives BH correction in the healthy-specific score, but MECP2 emerges as the strongest novel group-discriminator (KW H = 12.3) and EGR1 is the only TF hub in the analysis with a direct Open Targets T2D genetic-association score (0.163) — an important detail when prioritising hubs by genetic support.
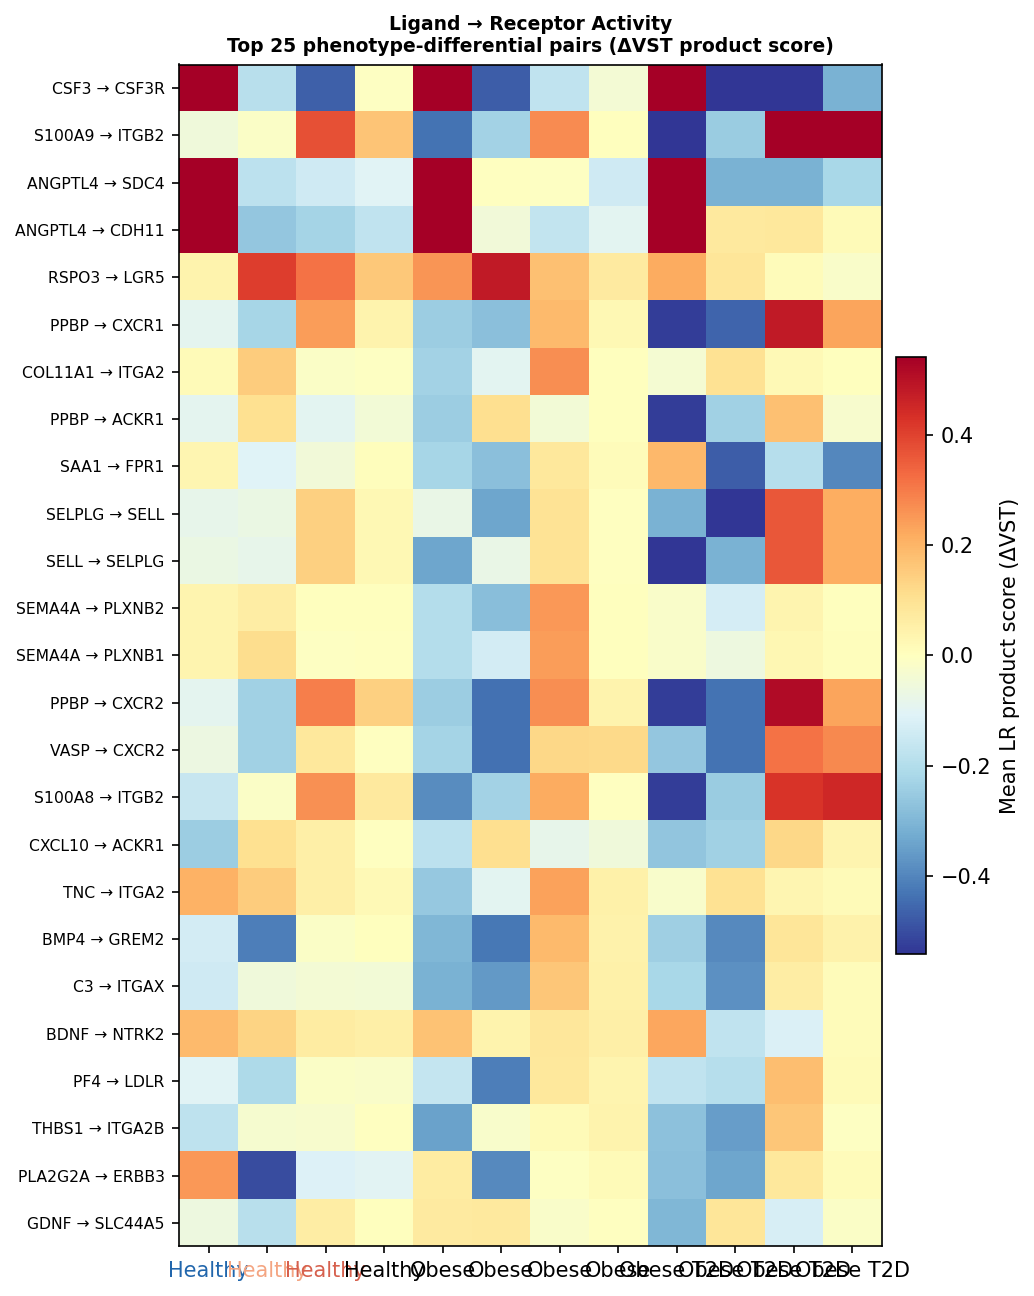
A bulk-adapted ligand–receptor inference across 2,100 LR pairs from 5 LIANA-curated databases highlights phenotype-differential axes that the original paper's gene-level analysis could not see:
| LR pair | p | Pattern |
|---|---|---|
| NAMPT → P2RY6 | 0.0021 | Healthy-specific, lost in disease |
| BMP5 → BMPR1A | 0.0022 | Progressive blunting Healthy > Obese > T2D |
| DLL1 → NOTCH1 | 0.0024 | Progressive blunting (satellite-cell programme) |
| PTN → PTPRS | 0.0025 | T2D-specific gain |
| WNT5A → FZD2 | 0.0062 | T2D-specific suppression |
| LPL → VLDLR | 0.0089 | T2D-specific gain — postprandial dyslipidemia |
At the RTK family level, the MET axis is the most differential: LRIG1→MET (p = 0.0115) and SEMA4D→MET (p = 0.0185) both blunt progressively from healthy to T2D. AREG→ERBB3 dominates as the highest-scoring ERBB axis but is shared across phenotypes (KW p = 0.872) — useful as a baseline normaliser, not a phenotype-specific hit. No LR pair survives BH FDR < 0.20: all hypothesis-generating, but the directional coherence is striking.
Step 4 — A discovery-grade biomarker panel from two orthogonal streams
We ran two independent streams: (a) Spearman correlation of every gene Δ, TF activity, and ssGSEA pathway against six metabolic axes (HOMA-IR, HbA1c, fasting insulin/glucose, C-peptide, BMI), and (b) ensemble classifier-based stability selection (ElasticNet + RandomForest, 20×7-fold nested CV, 200 bootstrap resamples).
Classifier performance:
| Model | Mean AUC (macro OvR) | 95% CI | Balanced Accuracy | Permutation p |
|---|---|---|---|---|
| ElasticNet | 0.985 | 0.833–1.0 | 0.883 | ≤ 0.005 |
| RandomForest | 0.993 | 0.833–1.0 | 0.960 | ≤ 0.005 |
Permutation p hits the 1/201 floor for both models. Caveat: with N = 21 the upper CI bound is sharply constrained; the AUC point estimate is impressive but the confidence interval is the honest read.
Cross-stream replicated features (clinical-correlation FDR<0.10 and stability ≥50% in either model): a 1-feature intersection (MAPRE2) and a 12-feature union panel (SPTY2D1, ATP5HP2, BMPR1A, SGK1, TBCAP1, SERTAD3, BTF3P13, UBAC2, MAPRE2, KIAA1522, PCDHB13, plus TFs MECP2 and OVOL1).
The biology behind the panel is rich:
- MAPRE2 (EB2) — microtubule plus-end tracker; directly relevant to insulin-receptor trafficking
- SGK1 — serum/glucocorticoid-regulated kinase; insulin/mTOR/FOXO axis
- BMPR1A — also the top progressive-blunting LR receptor in the LR analysis (cross-stream replication)
- MECP2 — emerging metabolic epigenetic regulator
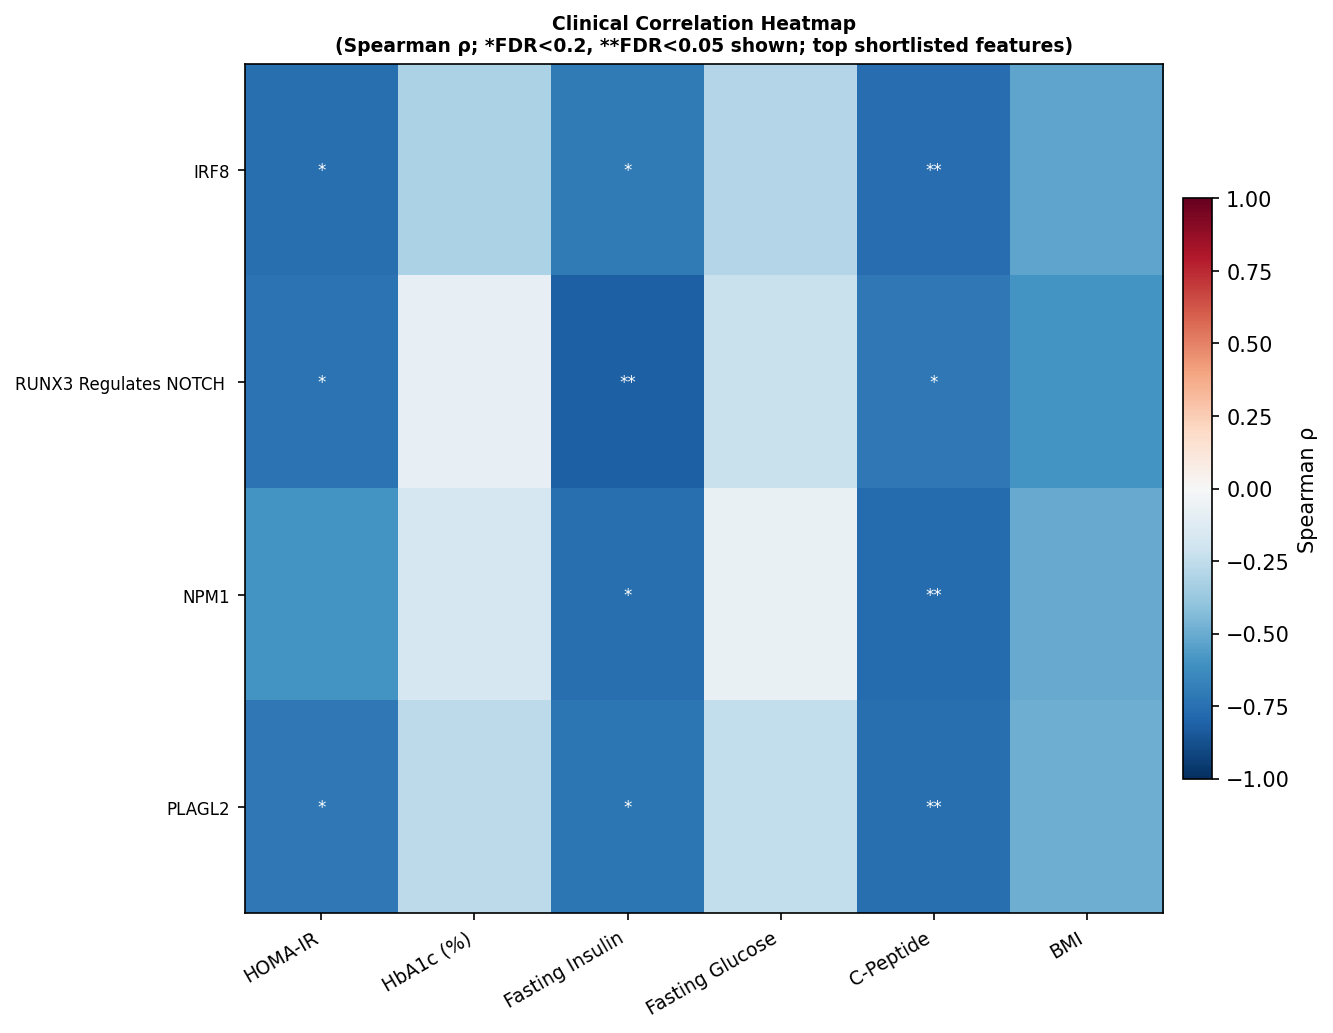
- NPM1 / IRF8 — strongest individual TF correlates of beta-cell function readouts (ρ ≈ −0.77 with C-peptide, FDR<0.05)
- EGR1 — only TF hub with Open Targets T2D genetic association
- SOX6 — strongest single clinical correlation of the entire analysis (ρ = +0.884 with HbA1c, FDR = 5×10⁻⁴)
Step 5 — Druggability: from receptor list to ranked, drugged nodes
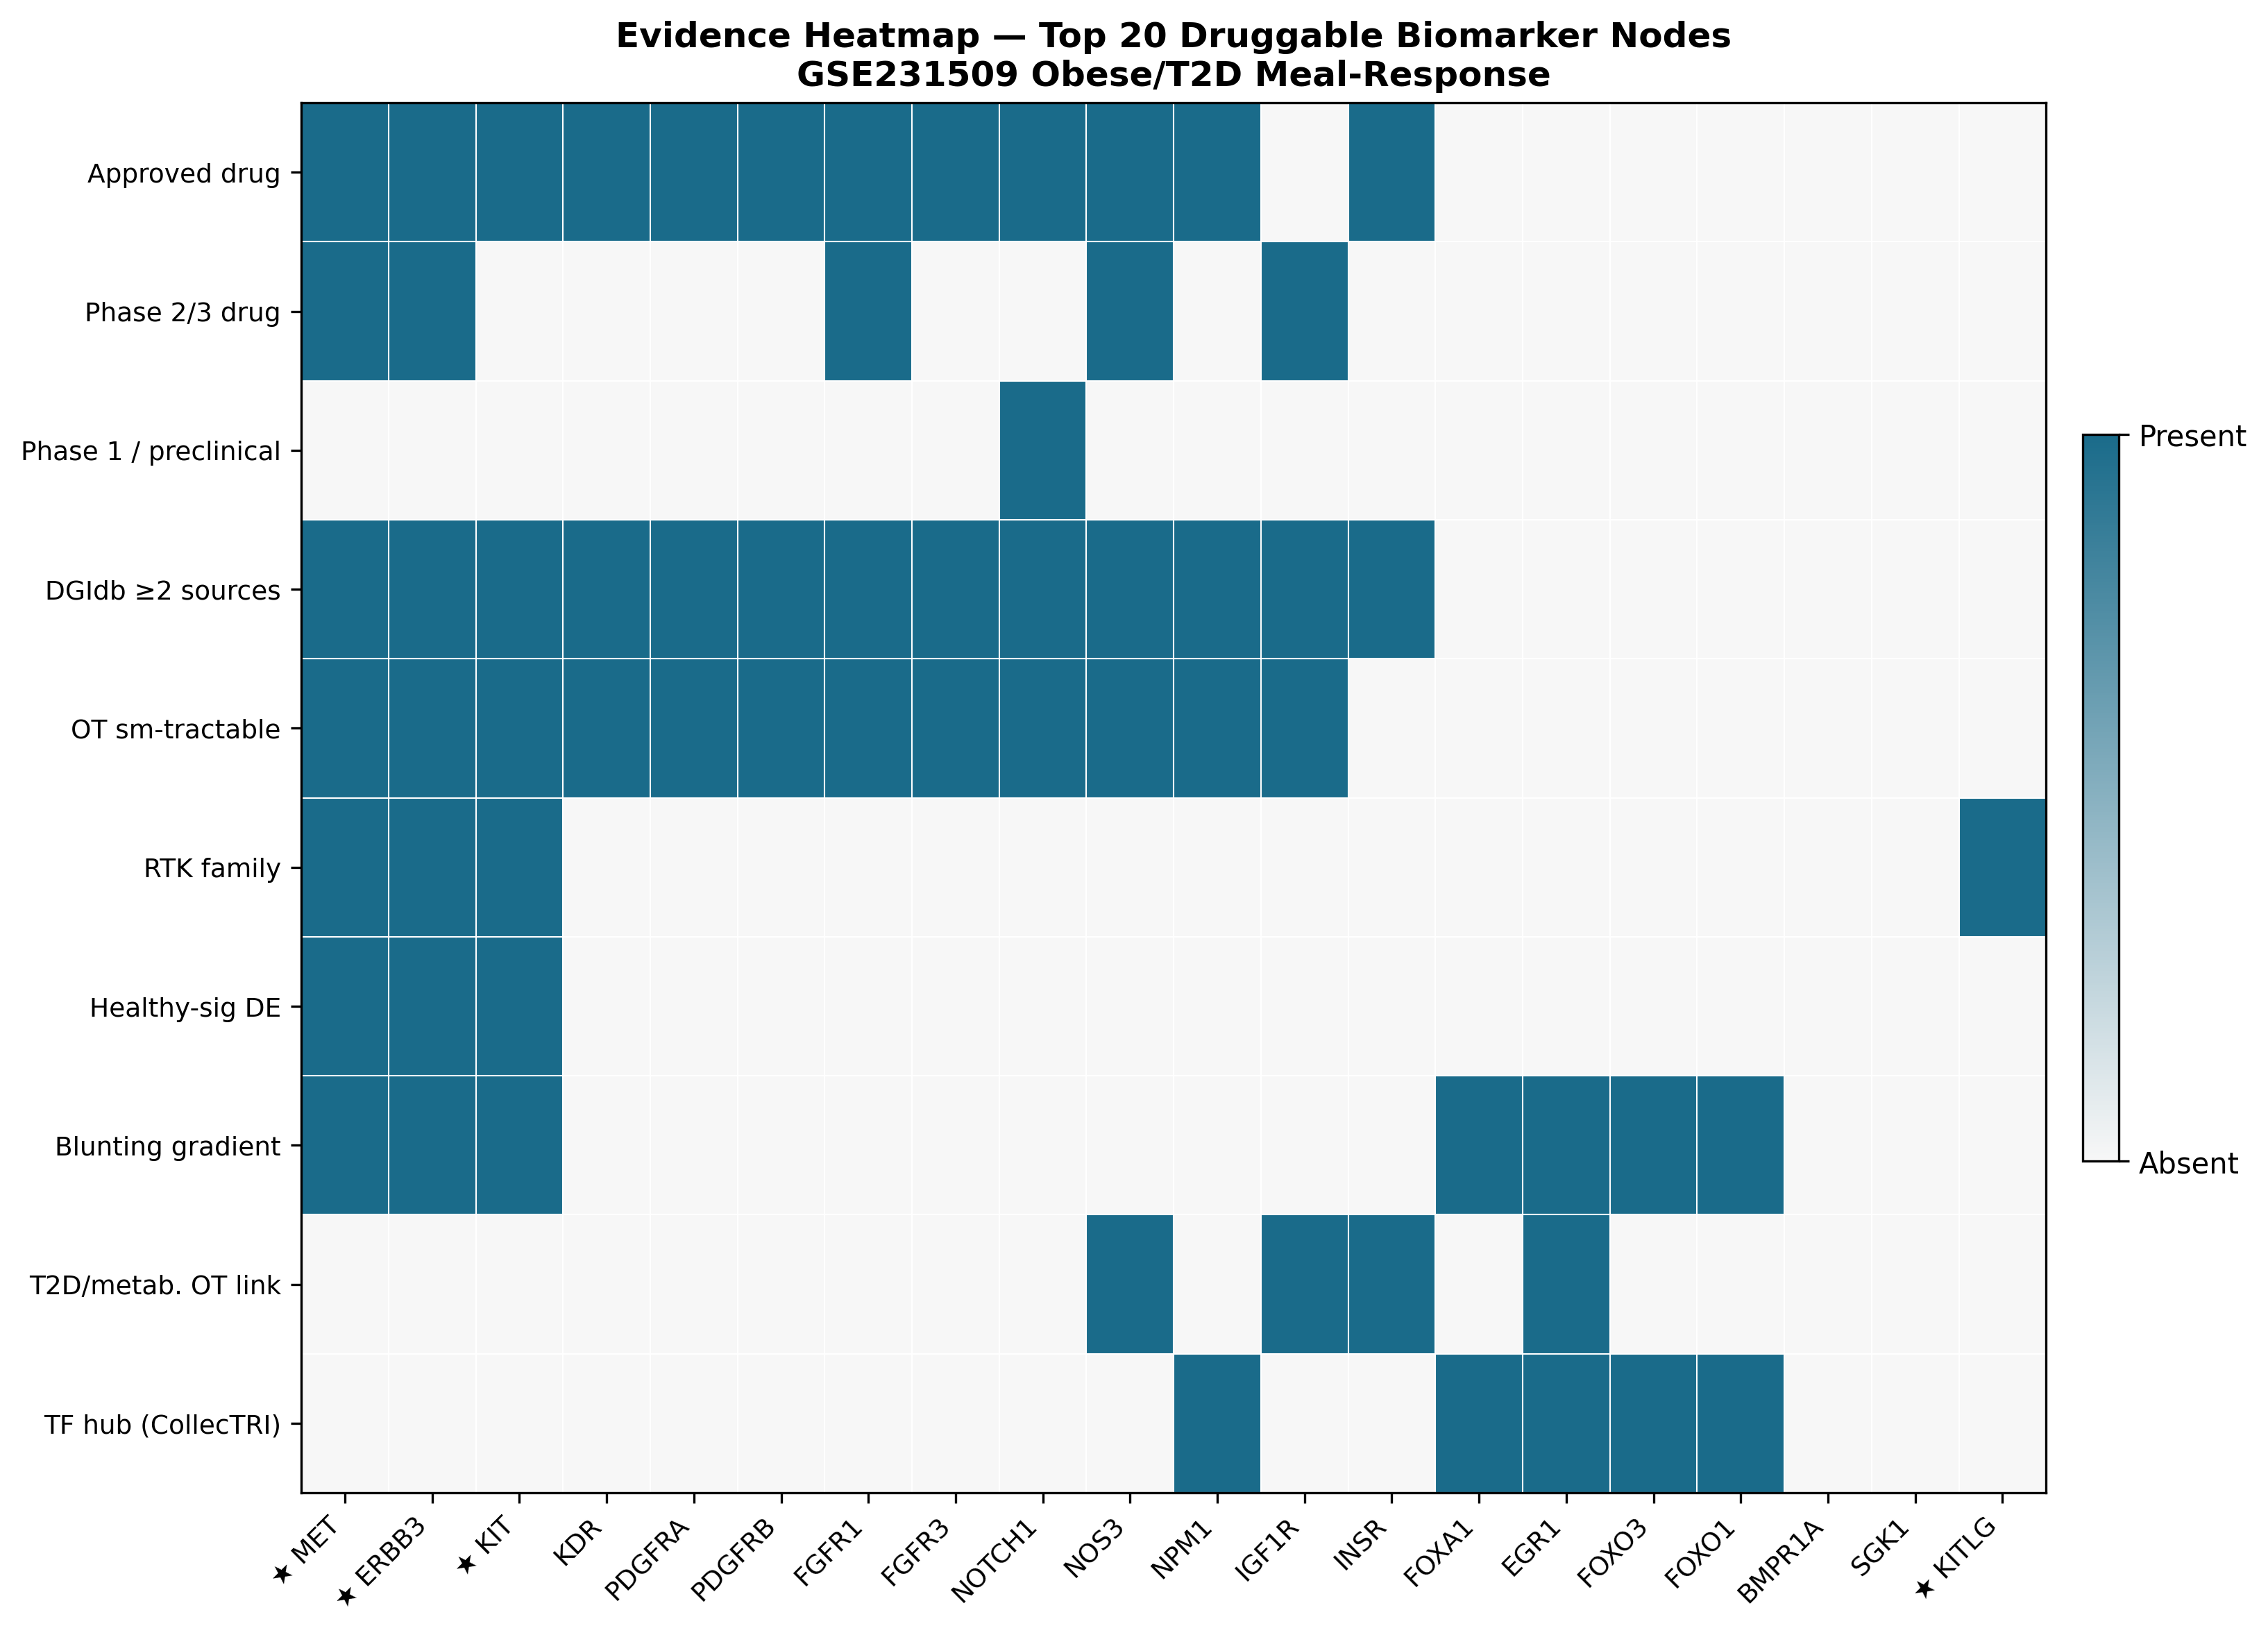
We computed a composite druggability score per candidate gene with explicit, weighted components, integrating DGIdb, ChEMBL, and Open Targets:
| Rank | Gene | Composite | Top drug | Tier | DGIdb sources |
|---|---|---|---|---|---|
| 1 | MET | 0.792 | Tepotinib / Capmatinib / Crizotinib / Cabozantinib | Tier 1 — Approved | 13 |
| 2 | ERBB3 | 0.766 | Pertuzumab / Seribantumab | Tier 1 — Approved | — |
| 3 | KIT | 0.659 | Imatinib / Avapritinib / Ripretinib | Tier 1 — Approved | — |
| 4 | KDR | 0.650 | Sorafenib | Tier 1 — Approved | — |
| 9 | NOTCH1 | 0.524 | Nirogacestat | Tier 1 — Approved | — |
| 10 | NOS3 | 0.521 | Sapropterin | Tier 1 (OT T2D 0.30) | — |
| 12 | IGF1R | 0.498 | Cixutumumab | Tier 2 — Phase 2/3 | — |
| 13 | INSR | 0.408 | Insulin formulations | Tier 1 (OT T2D 0.45) | — |
| 14 | FOXA1 | 0.175 | None direct | Tier 4 — Indirect | — |
| 15 | EGR1 | 0.124 | None direct | Tier 4 (OT T2D 0.163) | — |
MET tops the ranking with the deepest pharmacology in the list (4 approved drugs, 13 DGIdb sources) and the strongest blunting-gradient signal of any RTK in the dataset. KITLG is a separate flag — significantly downregulated in obese (LFC = −0.371, padj = 0.012) — pointing at a ligand-side intervention for the KIT axis.
The translational-medicine read
Three things sit in tension when a biopharma team looks at this dataset, and we want to put them on the table honestly.
1. The biology is convergent and reproducible. The RTK module replicates at gene, pathway, and (for MET) ligand–receptor levels. The FOX programme replicates. The progressive blunting of the meal response is a robust, monotonic phenotype. The novel anabolic/inflammatory dichotomy in T2D (induced MYC/translation/BCAA catabolism, blunted IL-6/JAK-STAT3 and TNFα/NF-κB) is a substantive extension of the original work and a plausible mechanistic model for why T2D muscle is metabolically inflexible and immunologically blunted at the same time.
2. The druggability layer turns the original observation into a prioritised, actionable list. MET, ERBB3, KIT — three approved-drug Tier-1 nodes — fall out at the top. KDR, NOTCH1 (nirogacestat), NOS3 (sapropterin), IGF1R, INSR follow with credible repurposing or known-target rationales. This is a concrete starting point for a target-prioritisation discussion that simply did not exist in the source paper.
3. The translational caveats are real and need to be flagged at the top of any internal memo.
- N = 21. No genes survive FDR<0.10 in the formal interaction model; no LR pairs survive FDR<0.20; no TFs survive FDR<0.05 for group discrimination. Everything here is discovery-grade Phase 1. The high classifier AUCs (0.985–0.993) are real, but the upper CI is constrained by sample size.
- Causal direction is unresolved. The healthy postprandial response is suppression of MET/ERBB3/KIT. In disease, that suppression is lost. Does therapy require inhibition (matching the healthy state by drug-induced suppression), agonism (rescuing the dynamic response), or upstream pathway rescue? Transcriptomic data alone cannot answer this. All Tier-1 drugs in the ranking are oncology kinase inhibitors developed for hyperactivation contexts.
- Genetic support is weak for the leading nodes. ERBB3, MET, and KIT are not GWAS-validated T2D risk loci. Of the entire druggable list, only INSR, IGF1R, NOS3, and EGR1 carry direct Open Targets T2D evidence.
- Bulk RNA-seq misses the cell-type story. NRG1/HGF non-replication is the canary: ligand biology in muscle is largely non-myofiber, and any next step should pair with single-nucleus RNA-seq.
- One time point (1h post-meal). Cannot distinguish a delayed response from an absent one.
A pragmatic next-step package
What we would do if this were an internal target-ID program:
- External validation cohort. Independent muscle-biopsy MMTT cohort with N ≥ 30/group; pre-registered MET/ERBB3/KIT, MAPRE2, SGK1, BMPR1A, IRF8/EGR1/NPM1 as primary endpoints.
- Single-nucleus follow-up to resolve myofiber vs immune vs satellite-cell contributions to the LR signal — the BMP5→BMPR1A and DLL1→NOTCH1 progressive-blunting axes are particularly worth resolving.
- In vitro causal-direction studies in primary human myotubes with MET inhibition vs agonism under postprandial-like nutrient flux to settle the inhibition-vs-rescue question before any in vivo commitment.
- Multiple time-point MMTT (15min / 1h / 3h) to capture the temporal envelope.
Bottom line
The original paper identified a real biological signal in 21 muscle biopsies. A modern reanalysis pipeline — paired DESeq2, decoupleR, LIANA, ensemble stability selection, composite druggability scoring across DGIdb / ChEMBL / Open Targets — reproduces the core finding, extends it with a graded metabolic divergence, a discovery-grade biomarker panel anchored on MAPRE2, SGK1, BMPR1A, MECP2, NPM1, IRF8, EGR1, and turns the receptor-level finding into a ranked druggability list led by MET (0.792), ERBB3 (0.766), KIT (0.659) — all backed by approved Tier-1 drugs.
For a biopharma audience: this is exactly the use case where a small, well-designed paired clinical study becomes a tractable target-ID resource — if the analysis depth matches the design quality. The translational risk is well-defined and the next-step experiments are specific. The data warrant a Phase-1 discovery investment, not a clinical commitment.
Re-analysis based on GSE231509 (Makhnovskii et al. 2023; PMID 37545425). Methods: paired DESeq2 with apeglm shrinkage; limma-voom + duplicateCorrelation for the interaction contrast; fgsea on Hallmark / KEGG / Reactome; decoupleR on CollecTRI + DoRothEA regulons; LIANA-curated 2,100-pair LR set with bulk-adapted ΔL × ΔR scoring; nested-CV ElasticNet + RandomForest with 200-permutation null and 200-resample stability selection; composite druggability score integrating DGIdb, ChEMBL, Open Targets.
Interested in this kind of analysis?
See how Inflexa turns small, well-designed clinical studies into safety-aware, mechanistically anchored druggable-node shortlists with full provenance.