From a NASH Liver Atlas to a Chemistry-Aware Repurposing Hypothesis
A two-stage computational case study
Why this case study is interesting
Most drug-repurposing posts stop at "compound X reverses the disease signature, therefore X is a candidate." That framing is brittle: it ignores chemistry, target selectivity, and the gap between transcriptome reversal and clinical benefit. The pipeline shown here goes two steps further.
Run 1 builds a NASH disease model from public RNA-seq + a toxicogenomics compendium and ranks 128 compounds by signature reversal. Run 2 then takes the #1 hit, theophylline, and does the chemistry homework: scaffold decomposition, isoform selectivity, off-target liability, and chemical-space mapping against 567 PDE4 inhibitors from ChEMBL.
The result is not a single drug nomination but a structured set of testable hypotheses with explicit failure modes.
The data
- GSE126848: bulk liver RNA-seq, 57 biopsies across healthy (n=14), obese (n=12), NAFLD (n=15), NASH (n=16). Polyadenylated RNA, Illumina NextSeq 500. Strong gender skew (47M / 10F).
- OpenRiskNet toxicogenomics compendium: 822 Affymetrix microarray profiles of HepG2 / HepaRG cells treated with 282 compounds (238 with ChEMBL IDs) at multiple doses and time points; each profile is a log-ratio versus matched DMSO control, labelled GTX (n=289) / NGTX (n=533).
- ChEMBL PDE4B/D bioactivity: 567 unique compounds with IC50 pChEMBL ≥ 5.0 (median pChEMBL 8.03, ≈9 nM).
The two transcriptomics datasets share an Ensembl gene space, which is what makes a CMap-style reversal scoring possible.
Run 1: Building the NASH disease model
A 1,306-gene NASH signature dominated by fibrogenesis and inflammation
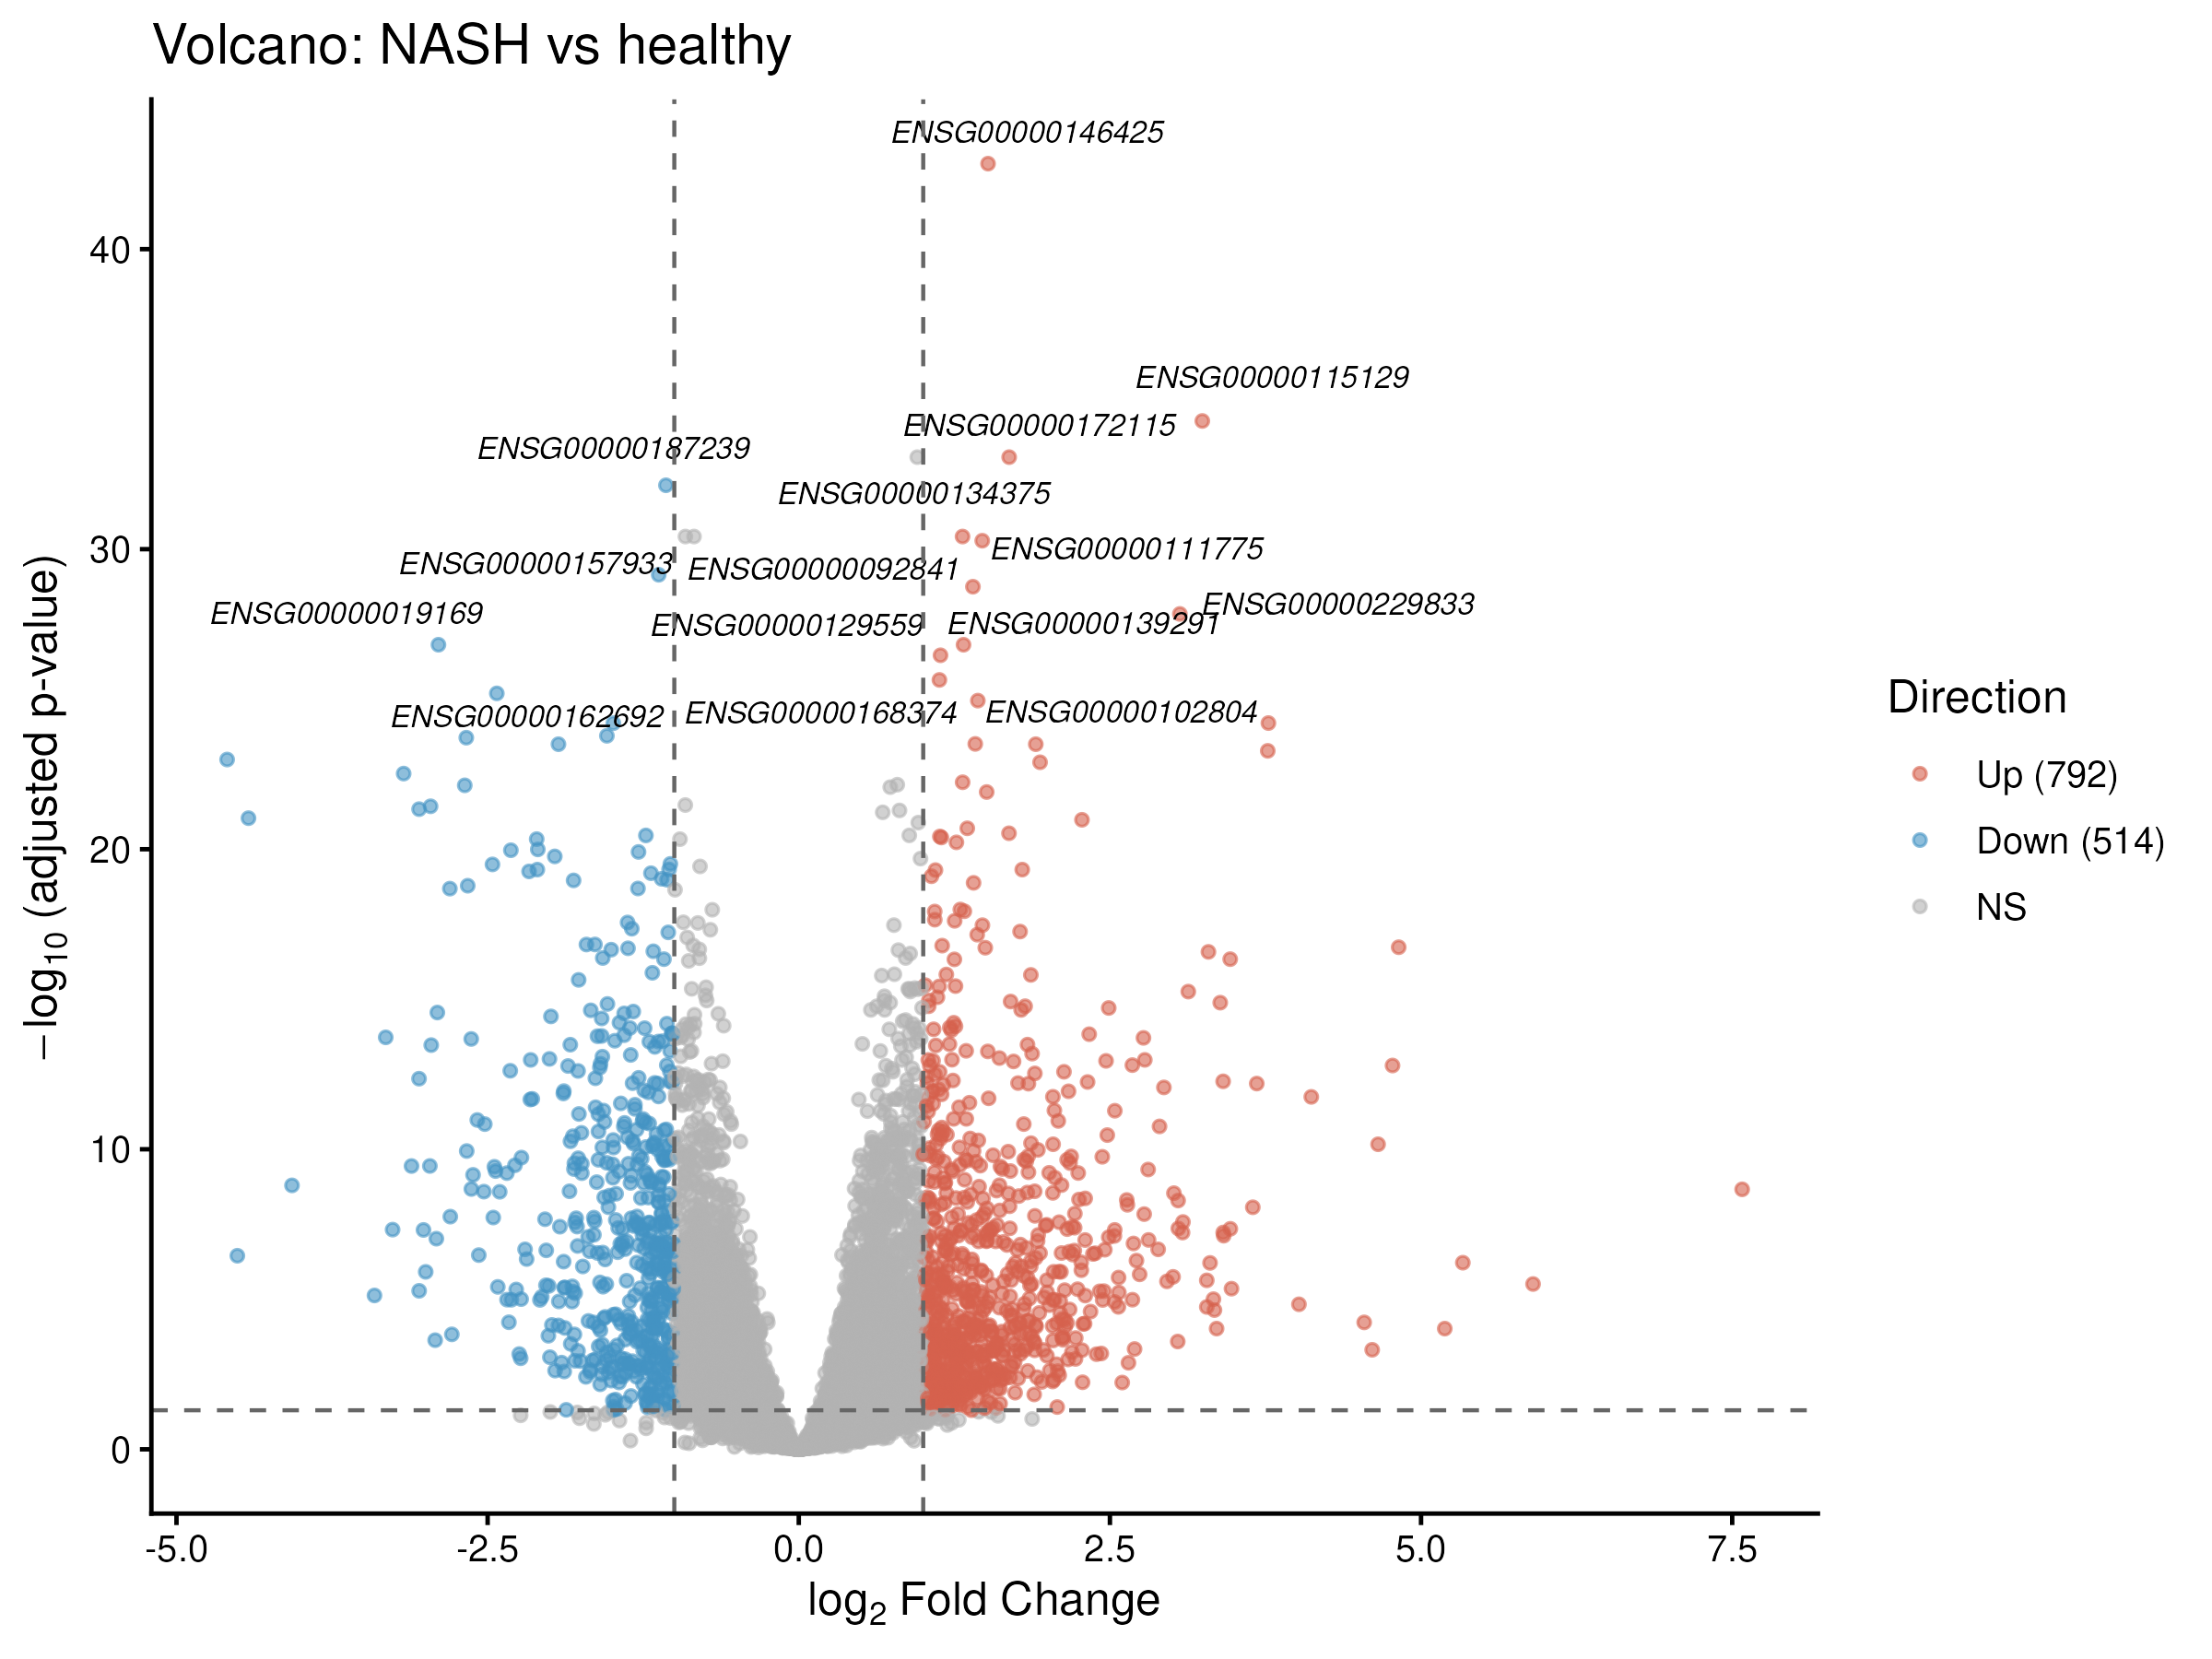
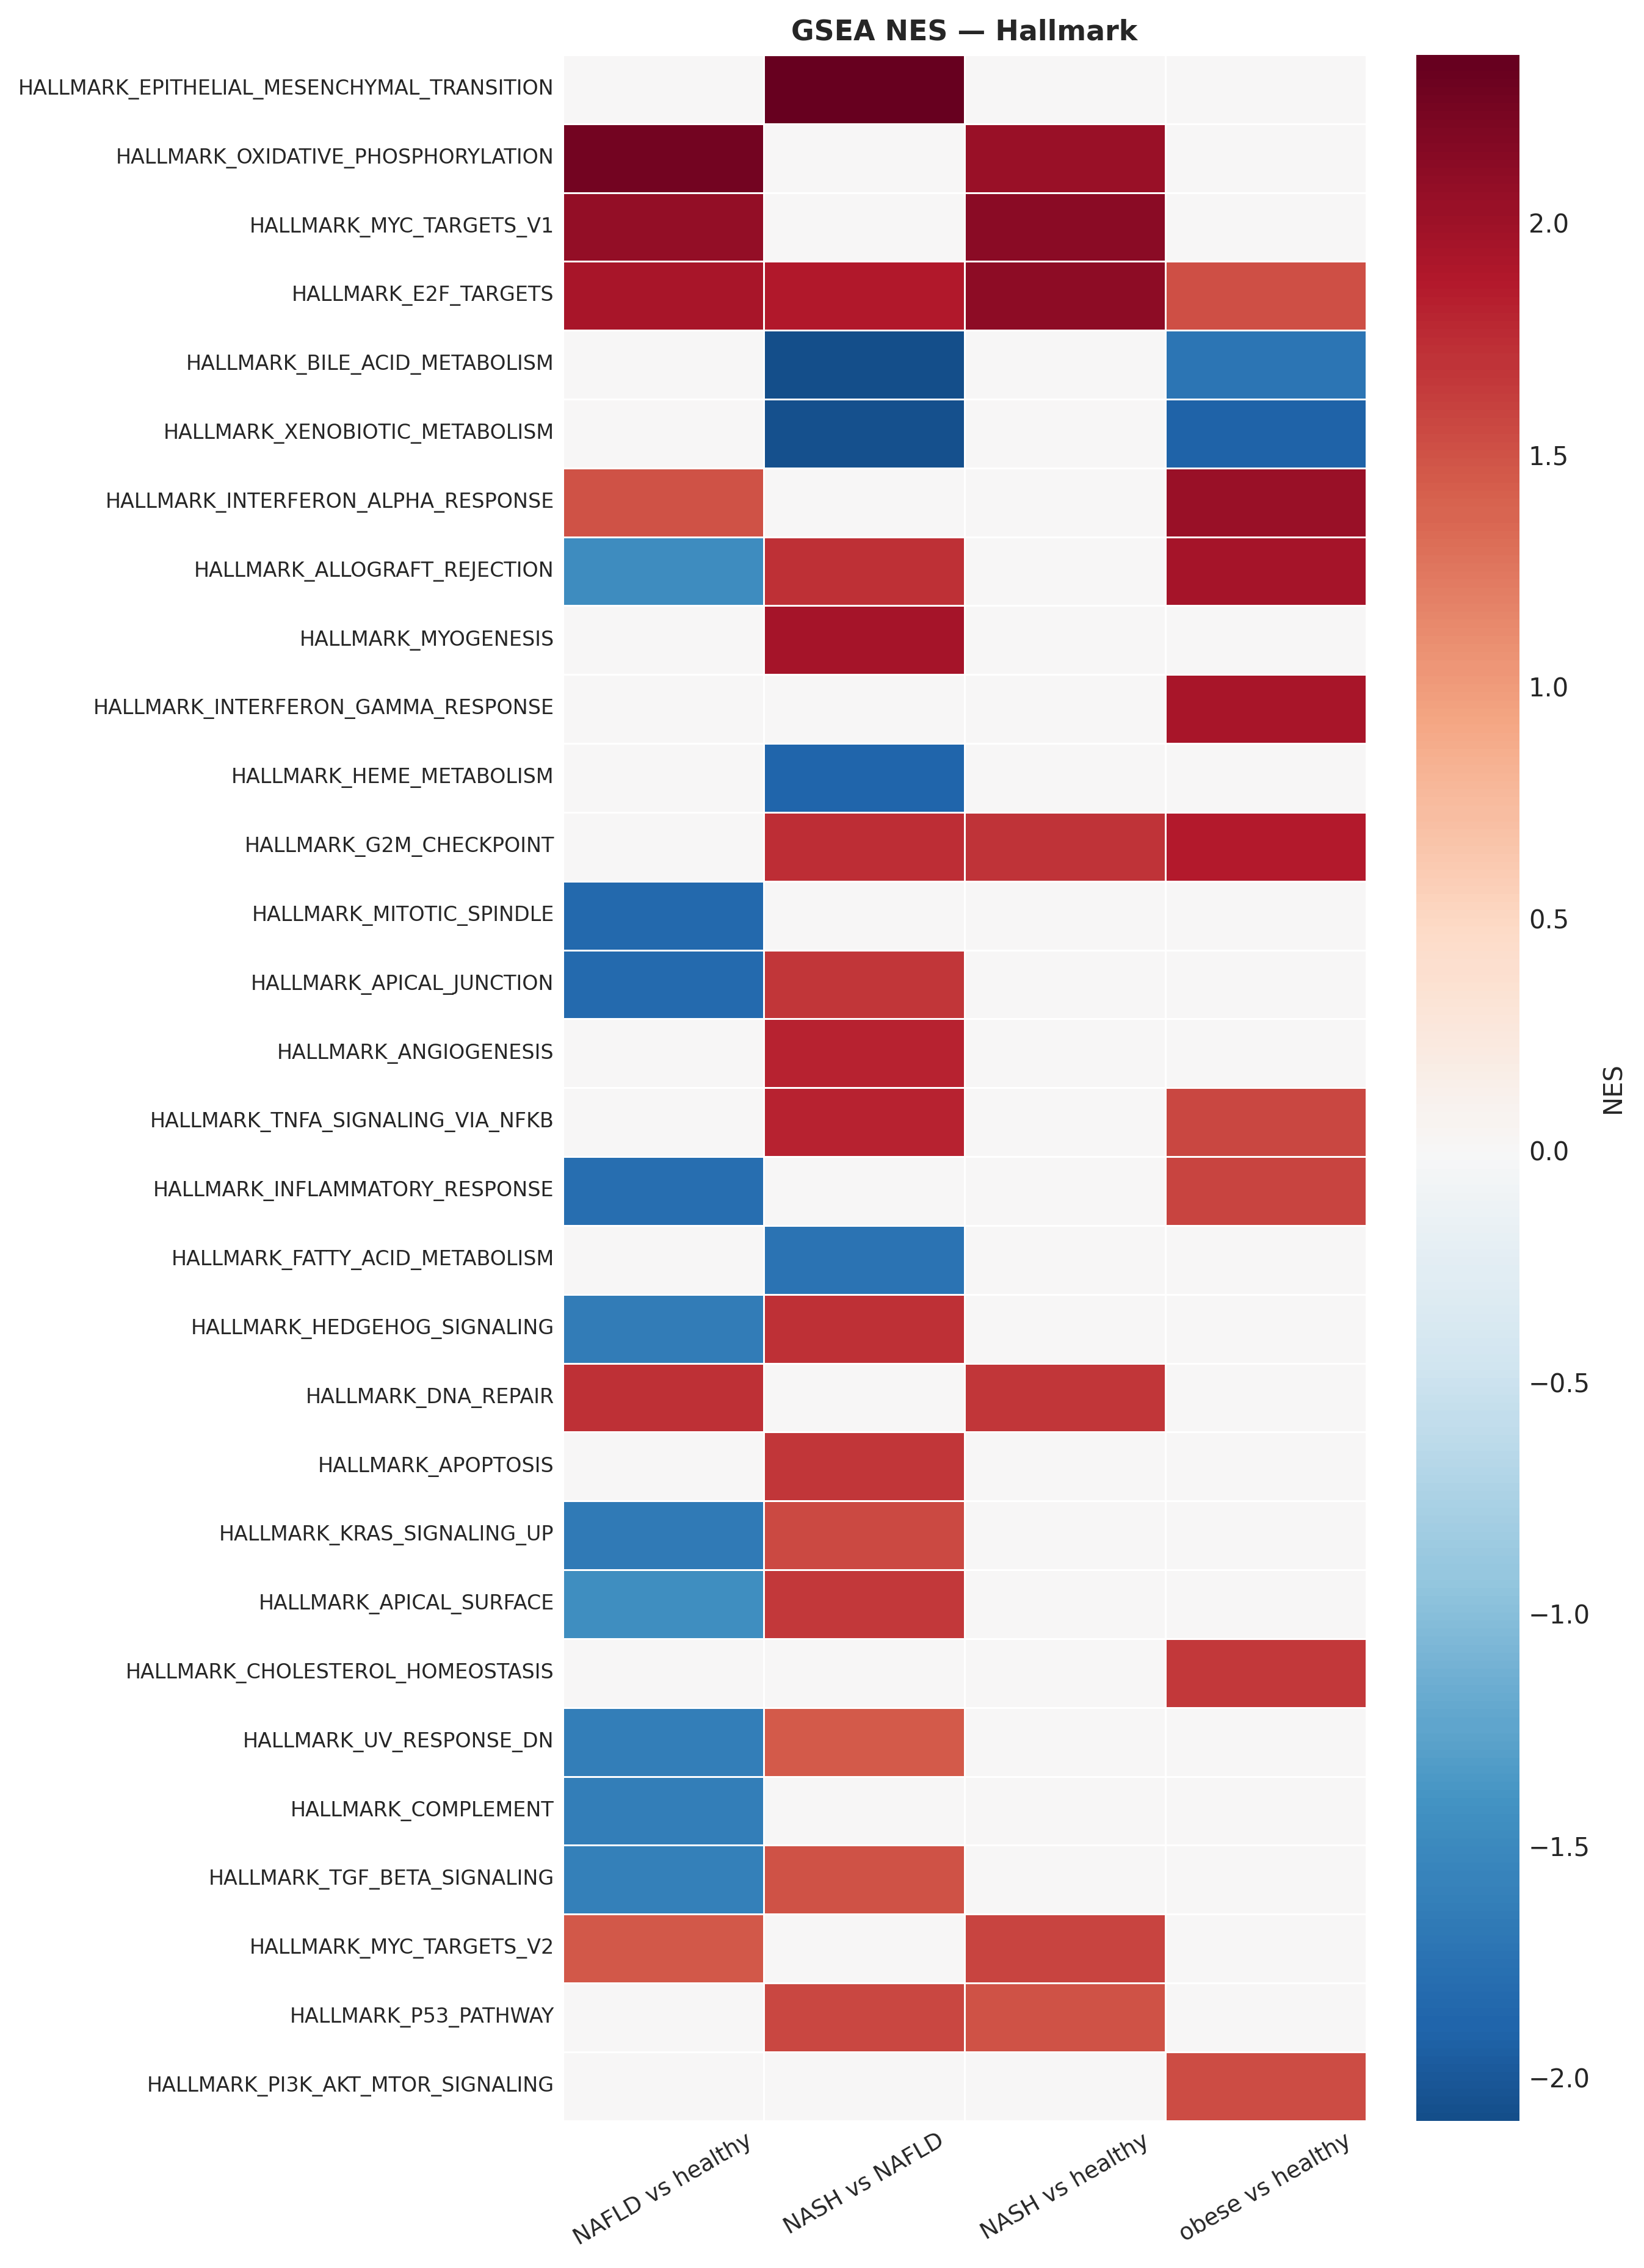
DESeq2 with a gender covariate identified 1,306 DE genes in NASH vs healthy liver (792 up, 514 down). Top-ranked genes (TP53I3, CYCS, DYNLT1, plus the canonical fibrosis triad SERPINE1 / MMP9 / THBS2) recapitulate established NASH biology validated in independent biopsy cohorts (Kozumi et al. 2021, Hepatology; Zhao et al. 2024).
Where does NASH actually start? A 54-gene NAFLD→NASH transition
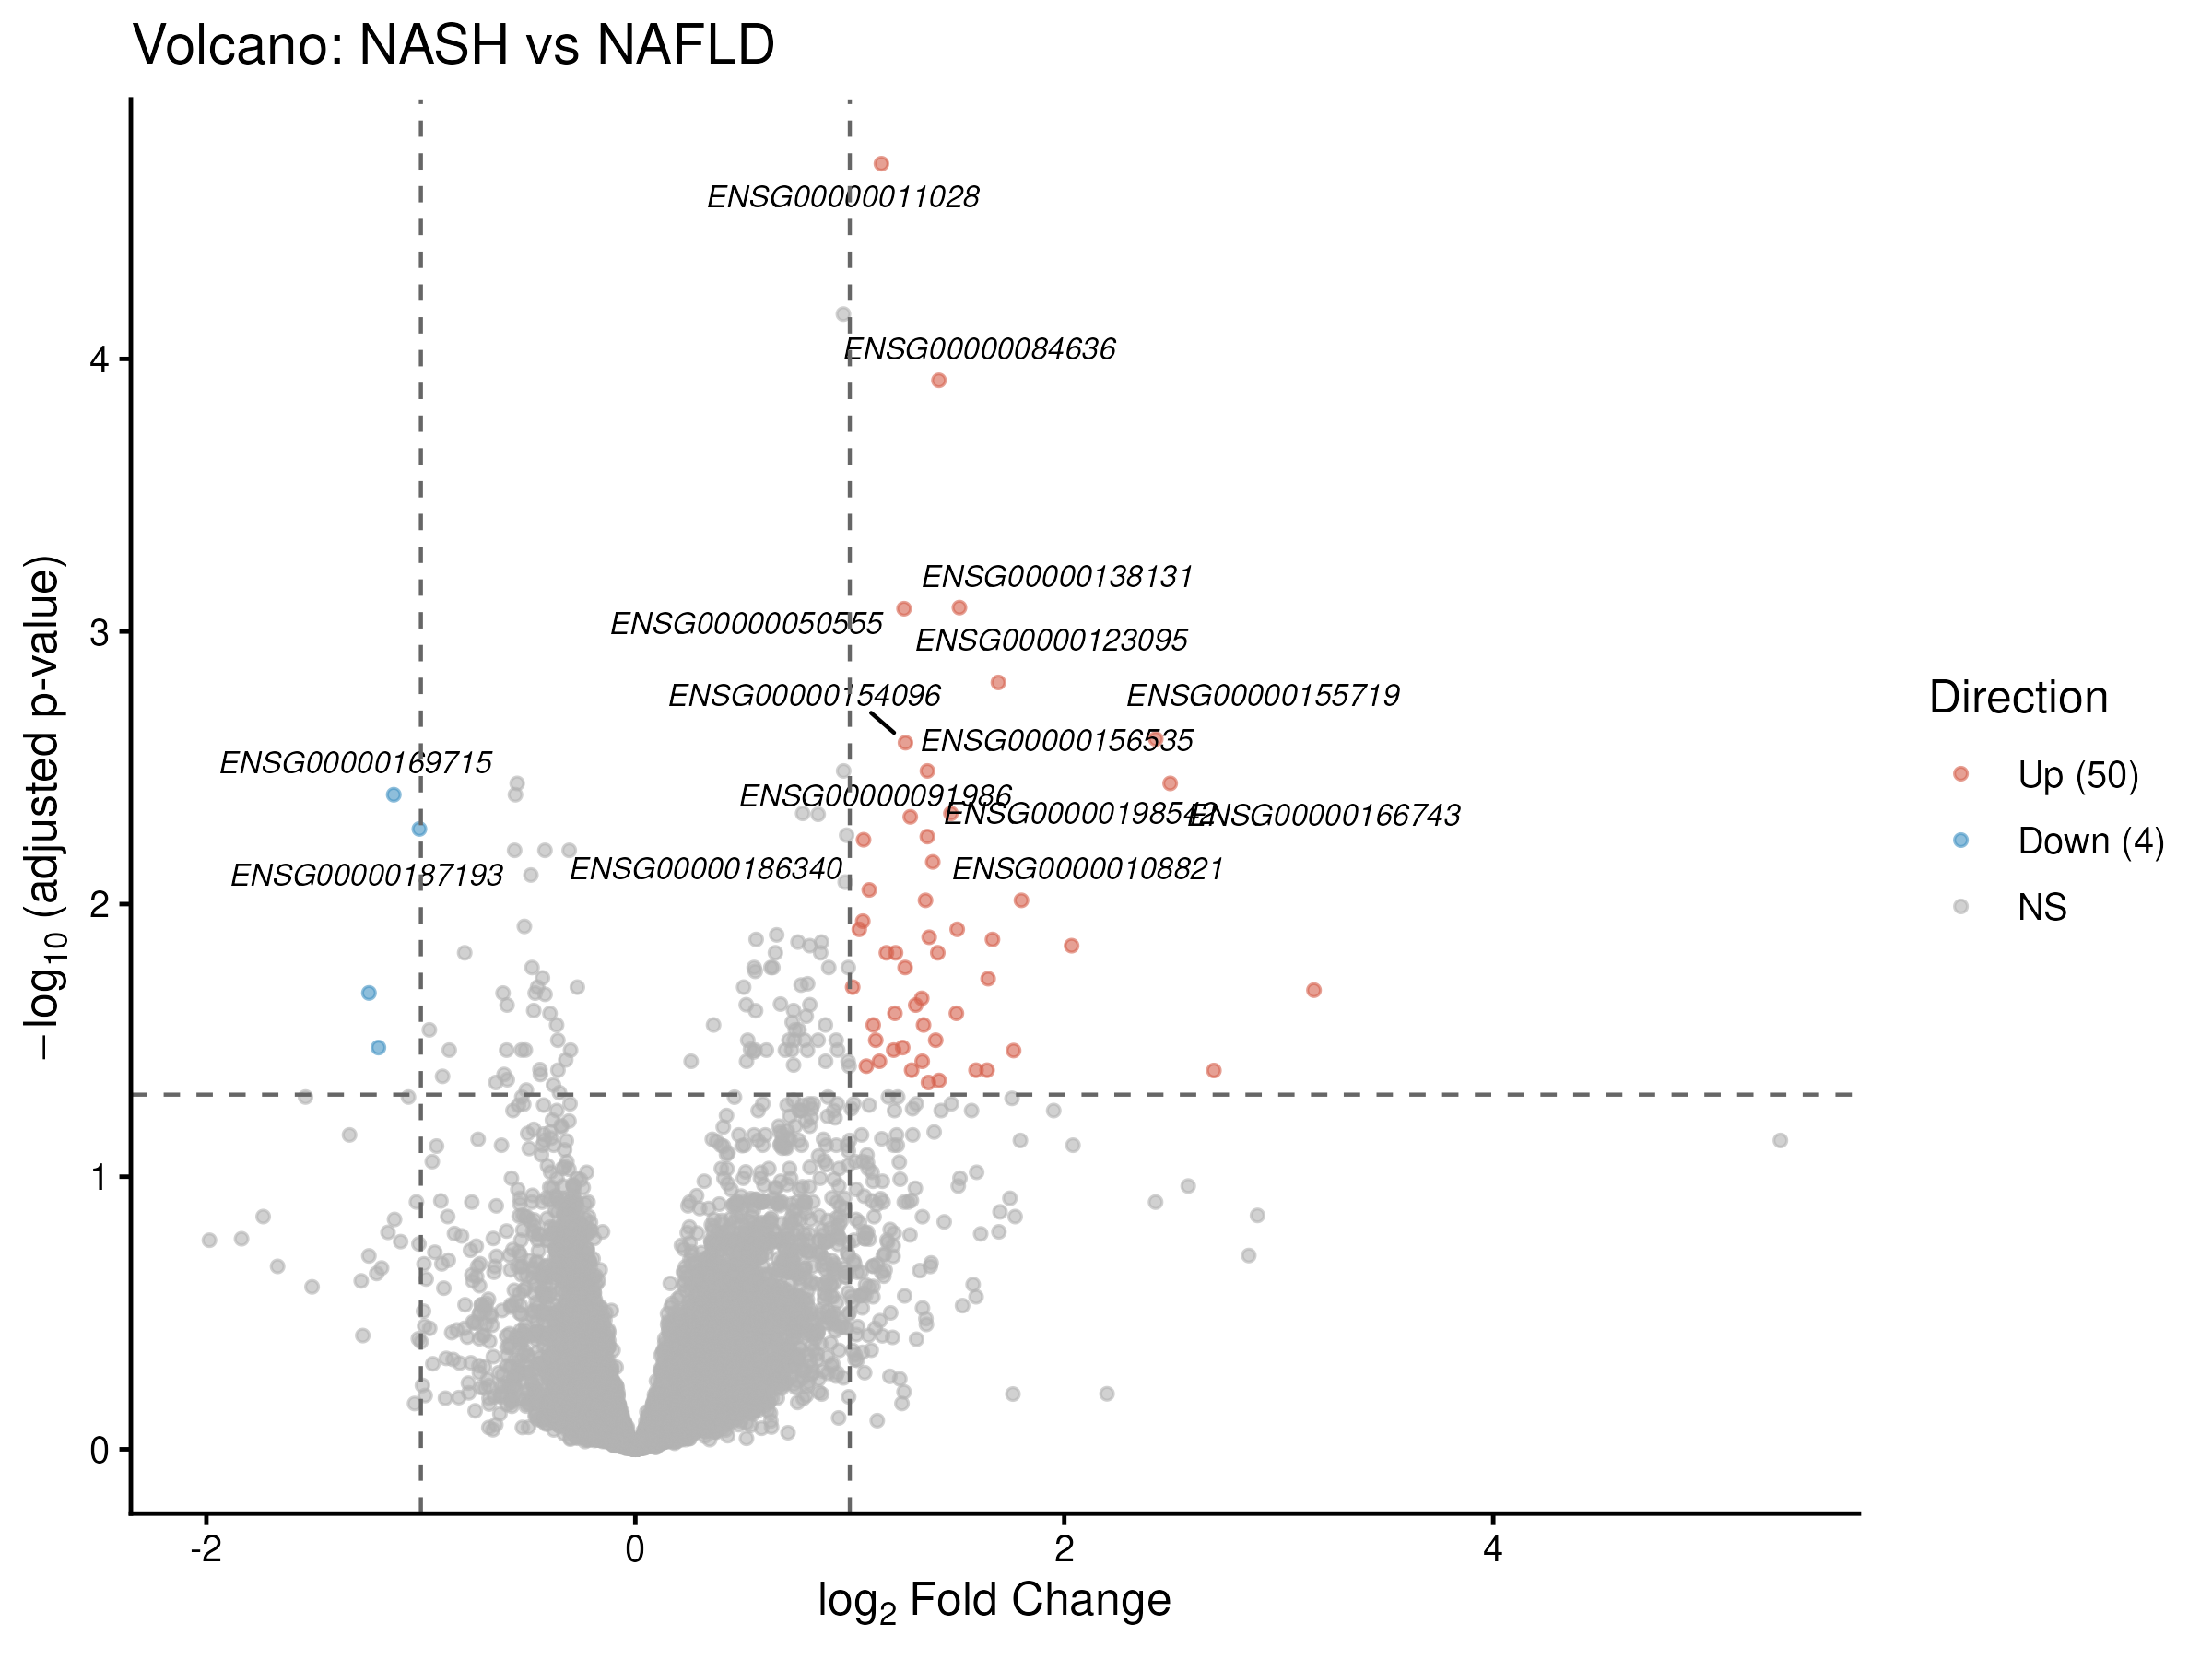
A gender-corrected NASH-vs-NAFLD contrast gave a much sharper, 54-gene signature with a striking 50:4 up/down asymmetry: COL1A1, COL16A1, LAMC3, LOXL4, ITGBL1, MRC2, THBS2, SERPINE1, CCDC80. This is the "fibrogenic switch": the transition from steatosis to steatohepatitis is overwhelmingly an activation program, not a loss-of-function.
LOXL4 in particular has been recently re-identified (over LOXL2) as the critical collagen-crosslinking enzyme in fibrosis (Ma et al. 2023, Sci Adv).
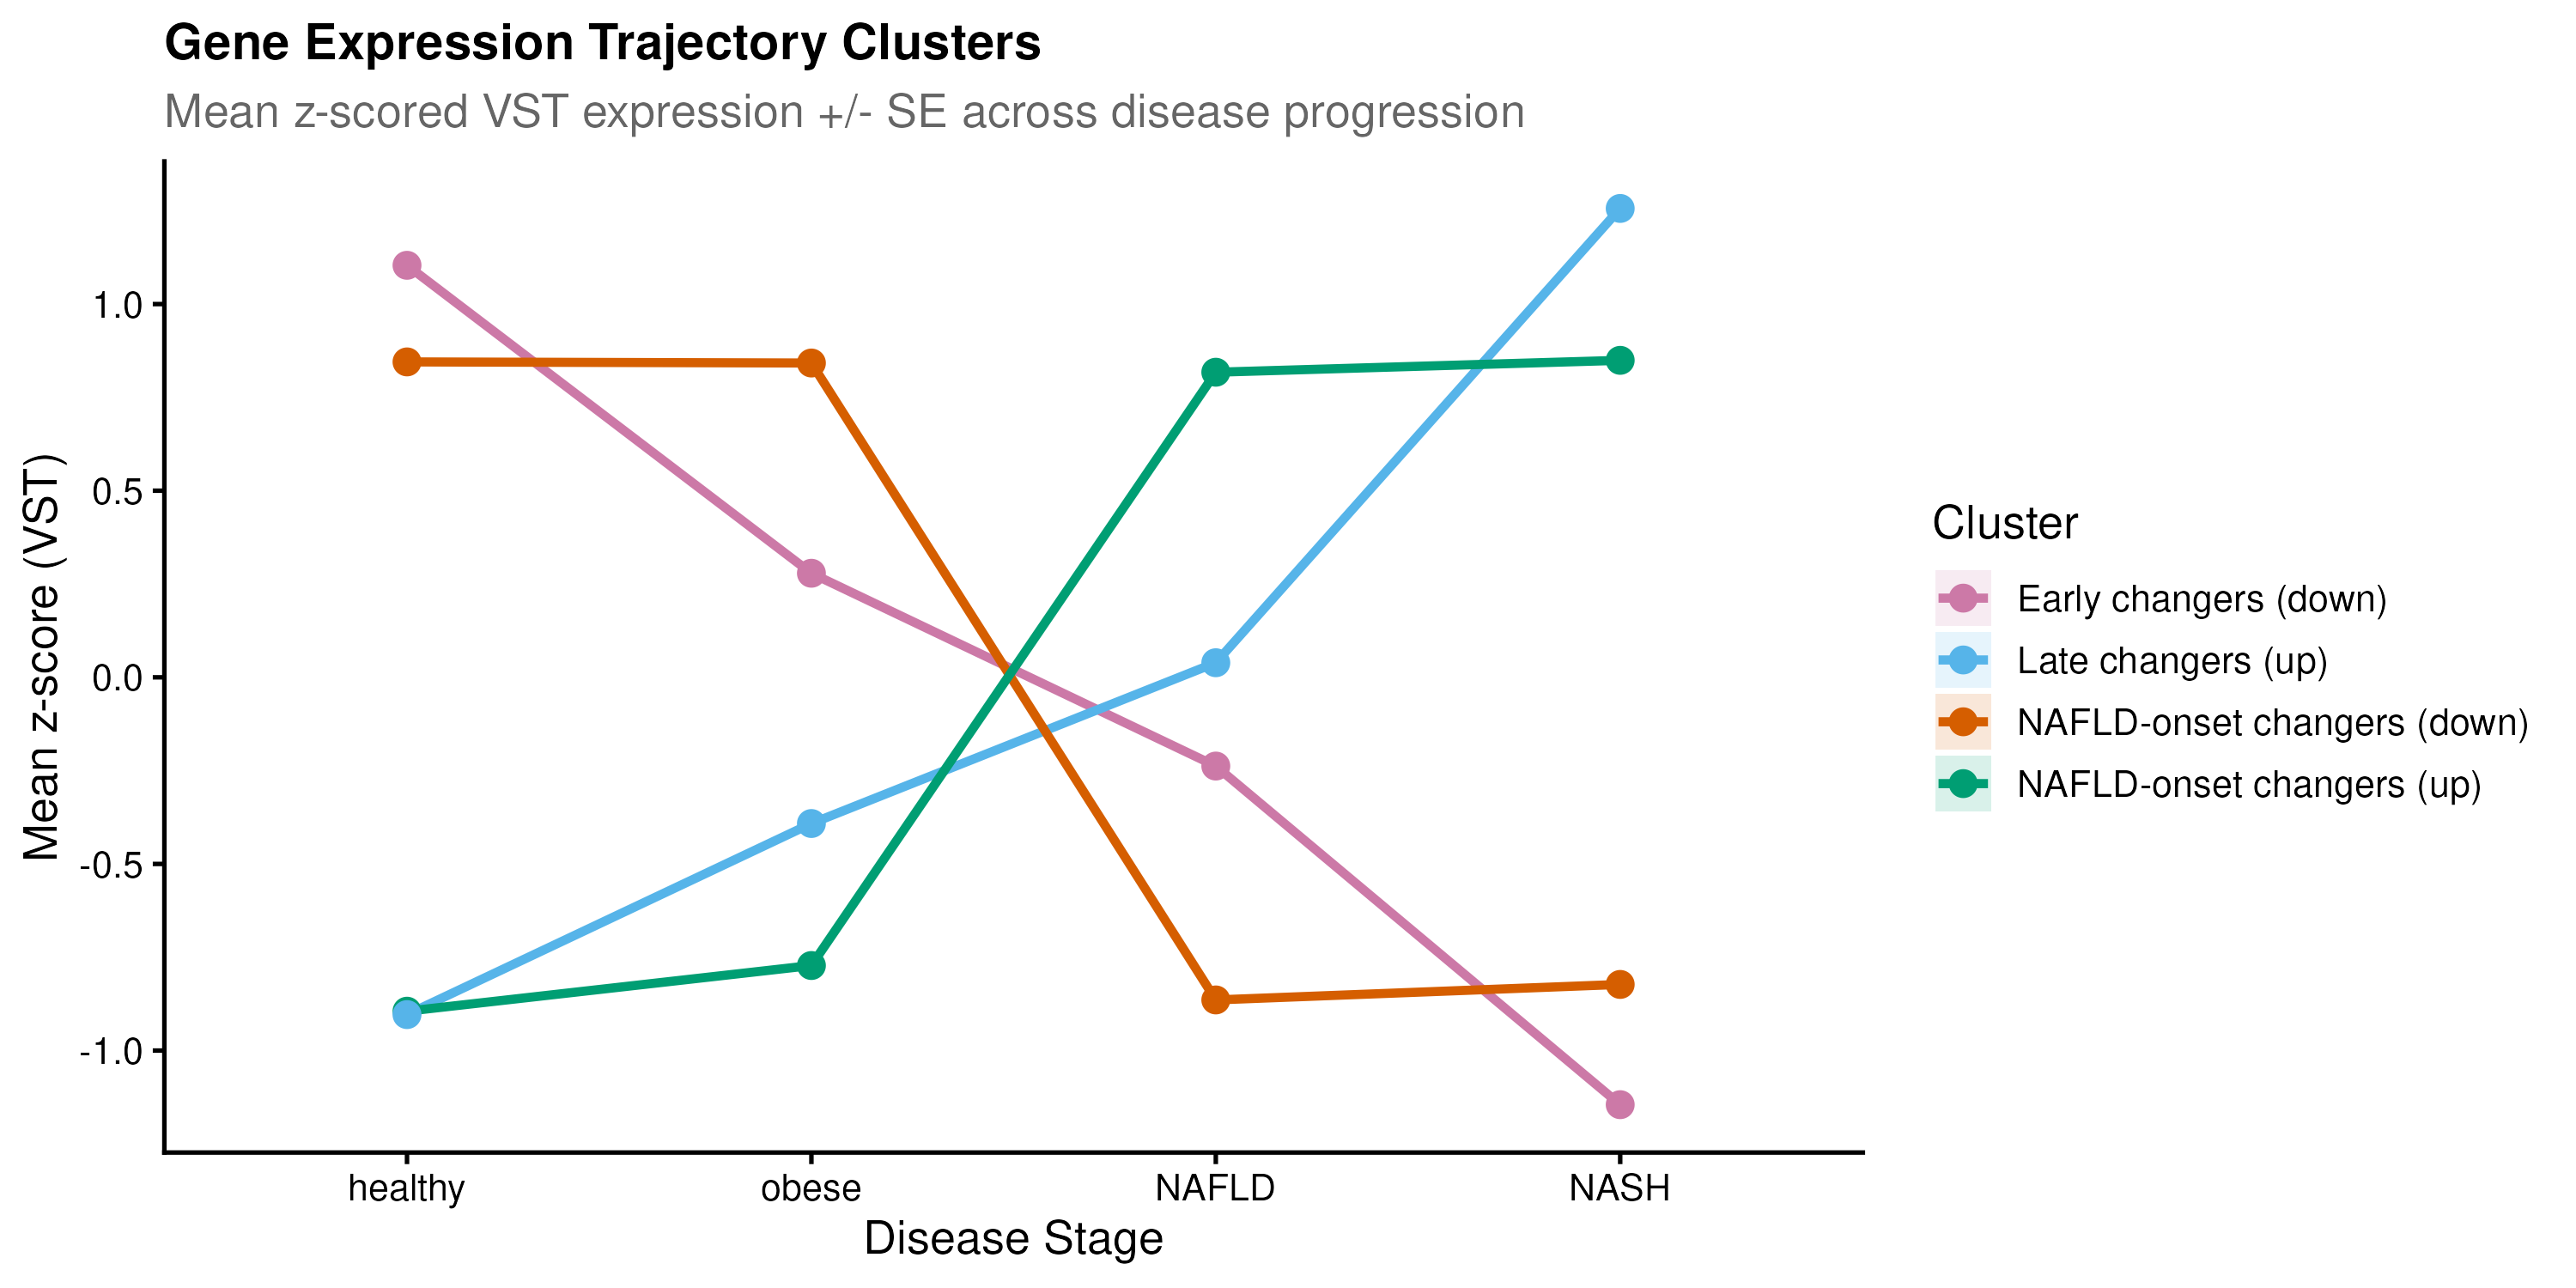
The dominant inflection point is obese → NAFLD, not NAFLD → NASH
LRT trajectory analysis on 6,782 progression genes clustered into four trends; the two largest clusters (4,729 genes combined) showed sharp expression changes at the obese-to-NAFLD boundary, while healthy and obese livers were transcriptomically near-identical.
P4HA1 (collagen prolyl hydroxylase) declined from obesity onward, a paradoxical early suppression of normal ECM homeostasis preceding the later fibrogenic switch. No prior literature reports this trajectory, making it a genuinely novel hypothesis worth experimental follow-up.
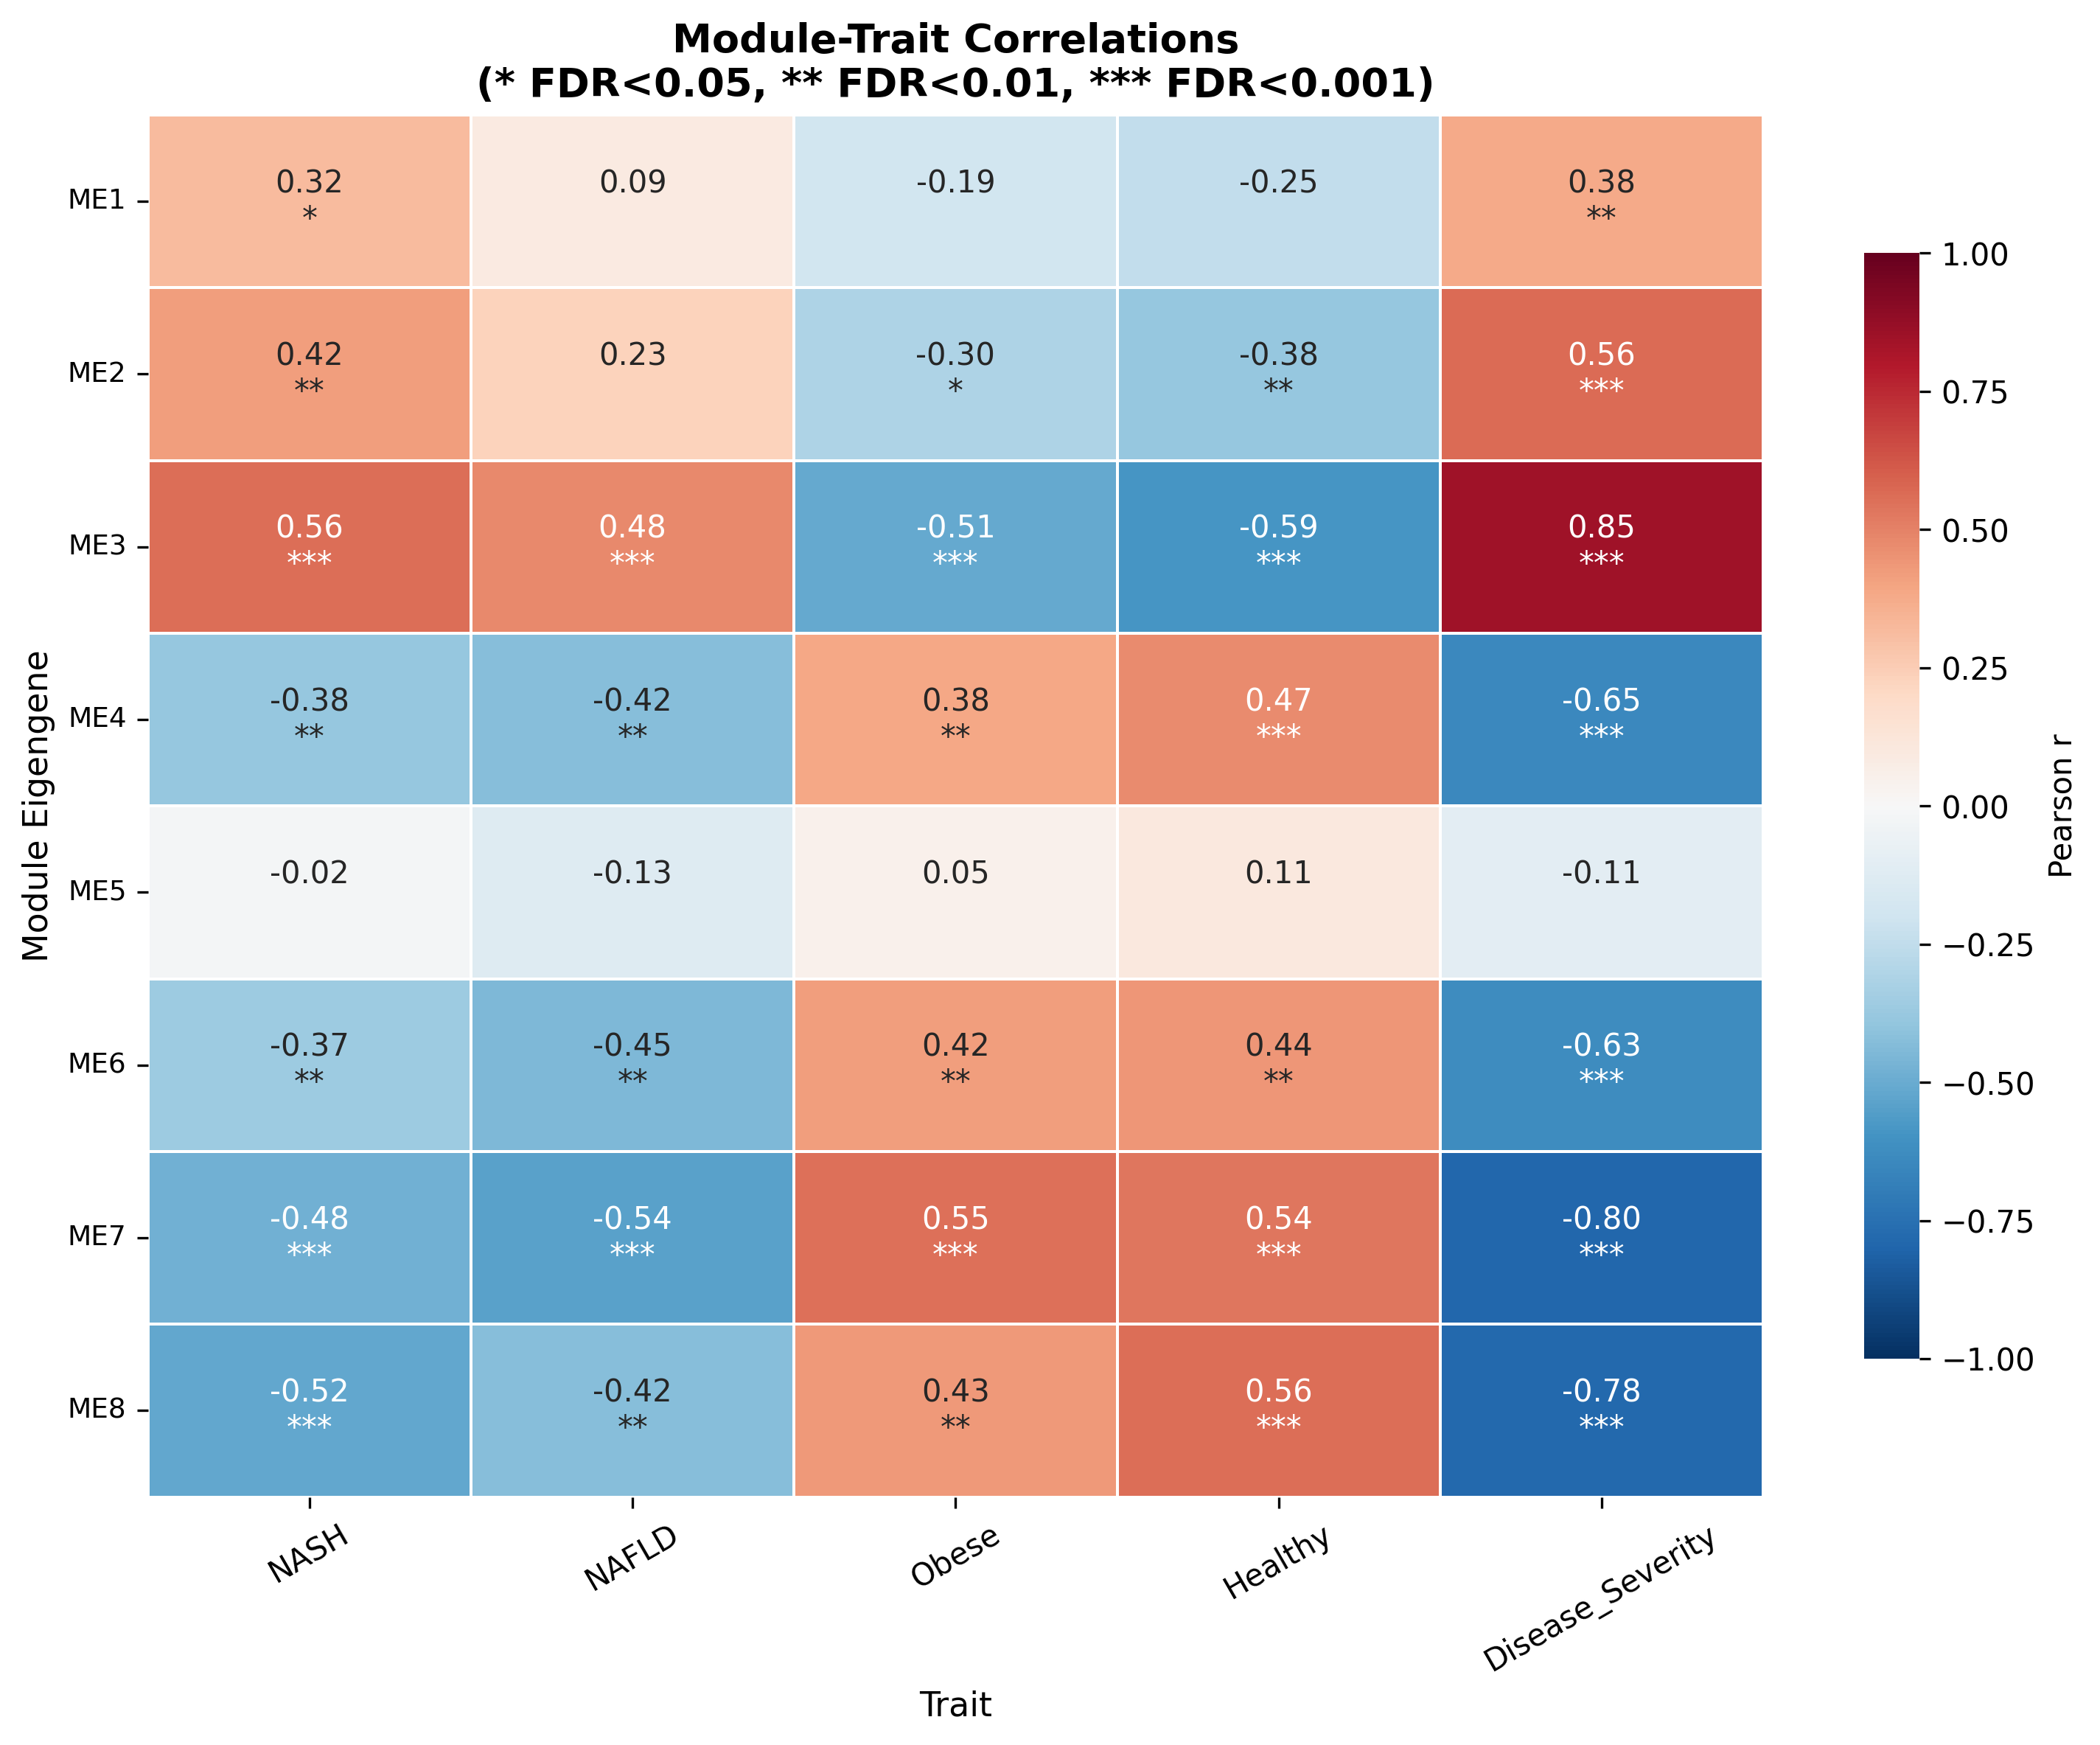
Co-expression modules expose two unexpected biology layers
WGCNA produced 8 modules; 7 correlated significantly with NASH status. Two stand out:
- M7 (r = −0.484) is a sinusoidal endothelial / Kupffer-cell identity module: KDR, FLT1, FLT4, CSF1R, CDH5, LYVE1, VCAM1. Its decline mirrors the documented replacement of embryo-derived TIMD4⁺/LYVE1⁺ Kupffer cells by pro-inflammatory monocyte-derived macrophages.
- M1 (r = +0.318) is an RNA-processing / splicing module led by ZC3H13 (a core m6A methyltransferase complex component), RBM25, NEMF, SRSF11, PHIP. Splicing dysregulation in NASH is established for SRSF1/SRSF6, but the specific M1 composition and ZC3H13's epitranscriptomic contribution are novel.
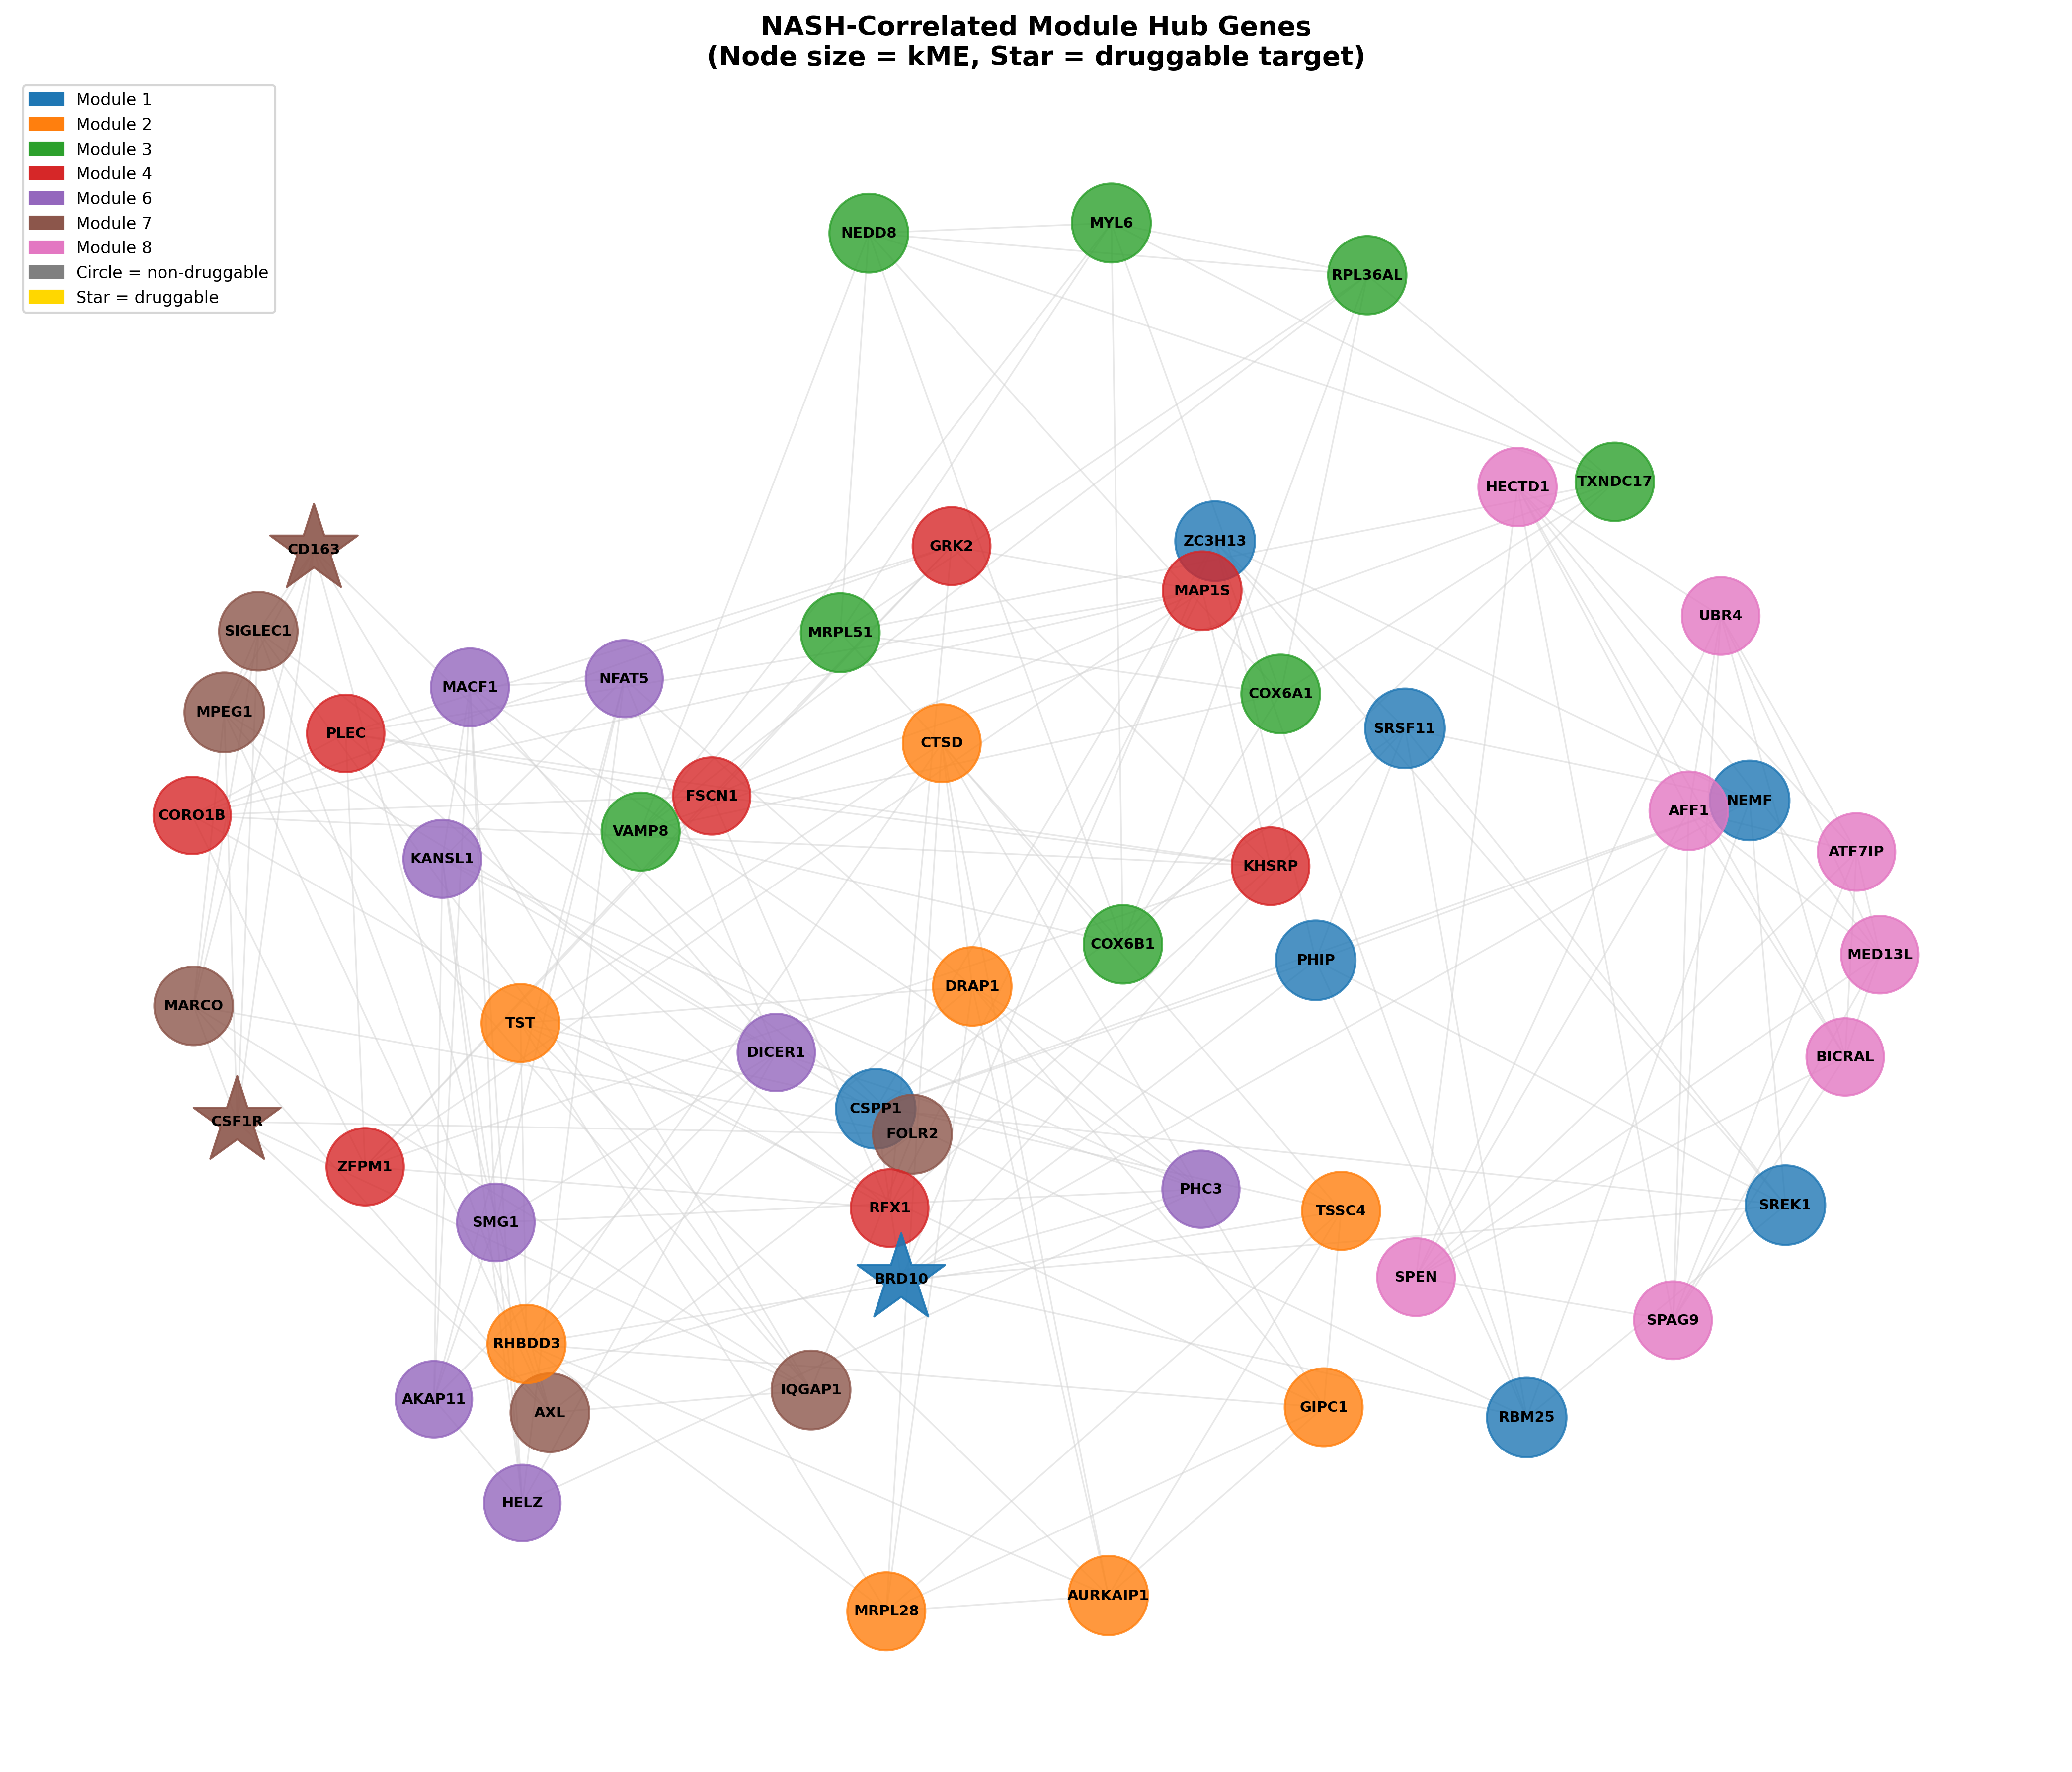
A novel single-gene hypothesis: TIMD4 collapse
TIMD4 (TIM-4, the Kupffer-cell phosphatidylserine receptor for efferocytosis) is among the most strongly downregulated genes in the dataset (log2FC = −4.42). A landmark 2025 Sci Transl Med paper (Shi et al., PMID 40929246), published after this hypothesis would have been generated, provides direct causal validation: TIM4 loss impairs apoptotic hepatocyte clearance and drives HSC activation through loss of macrophage IL-10.
This connects M7 (KC identity loss) to the SERPINE1/fibrosis axis as a single mechanistic chain.
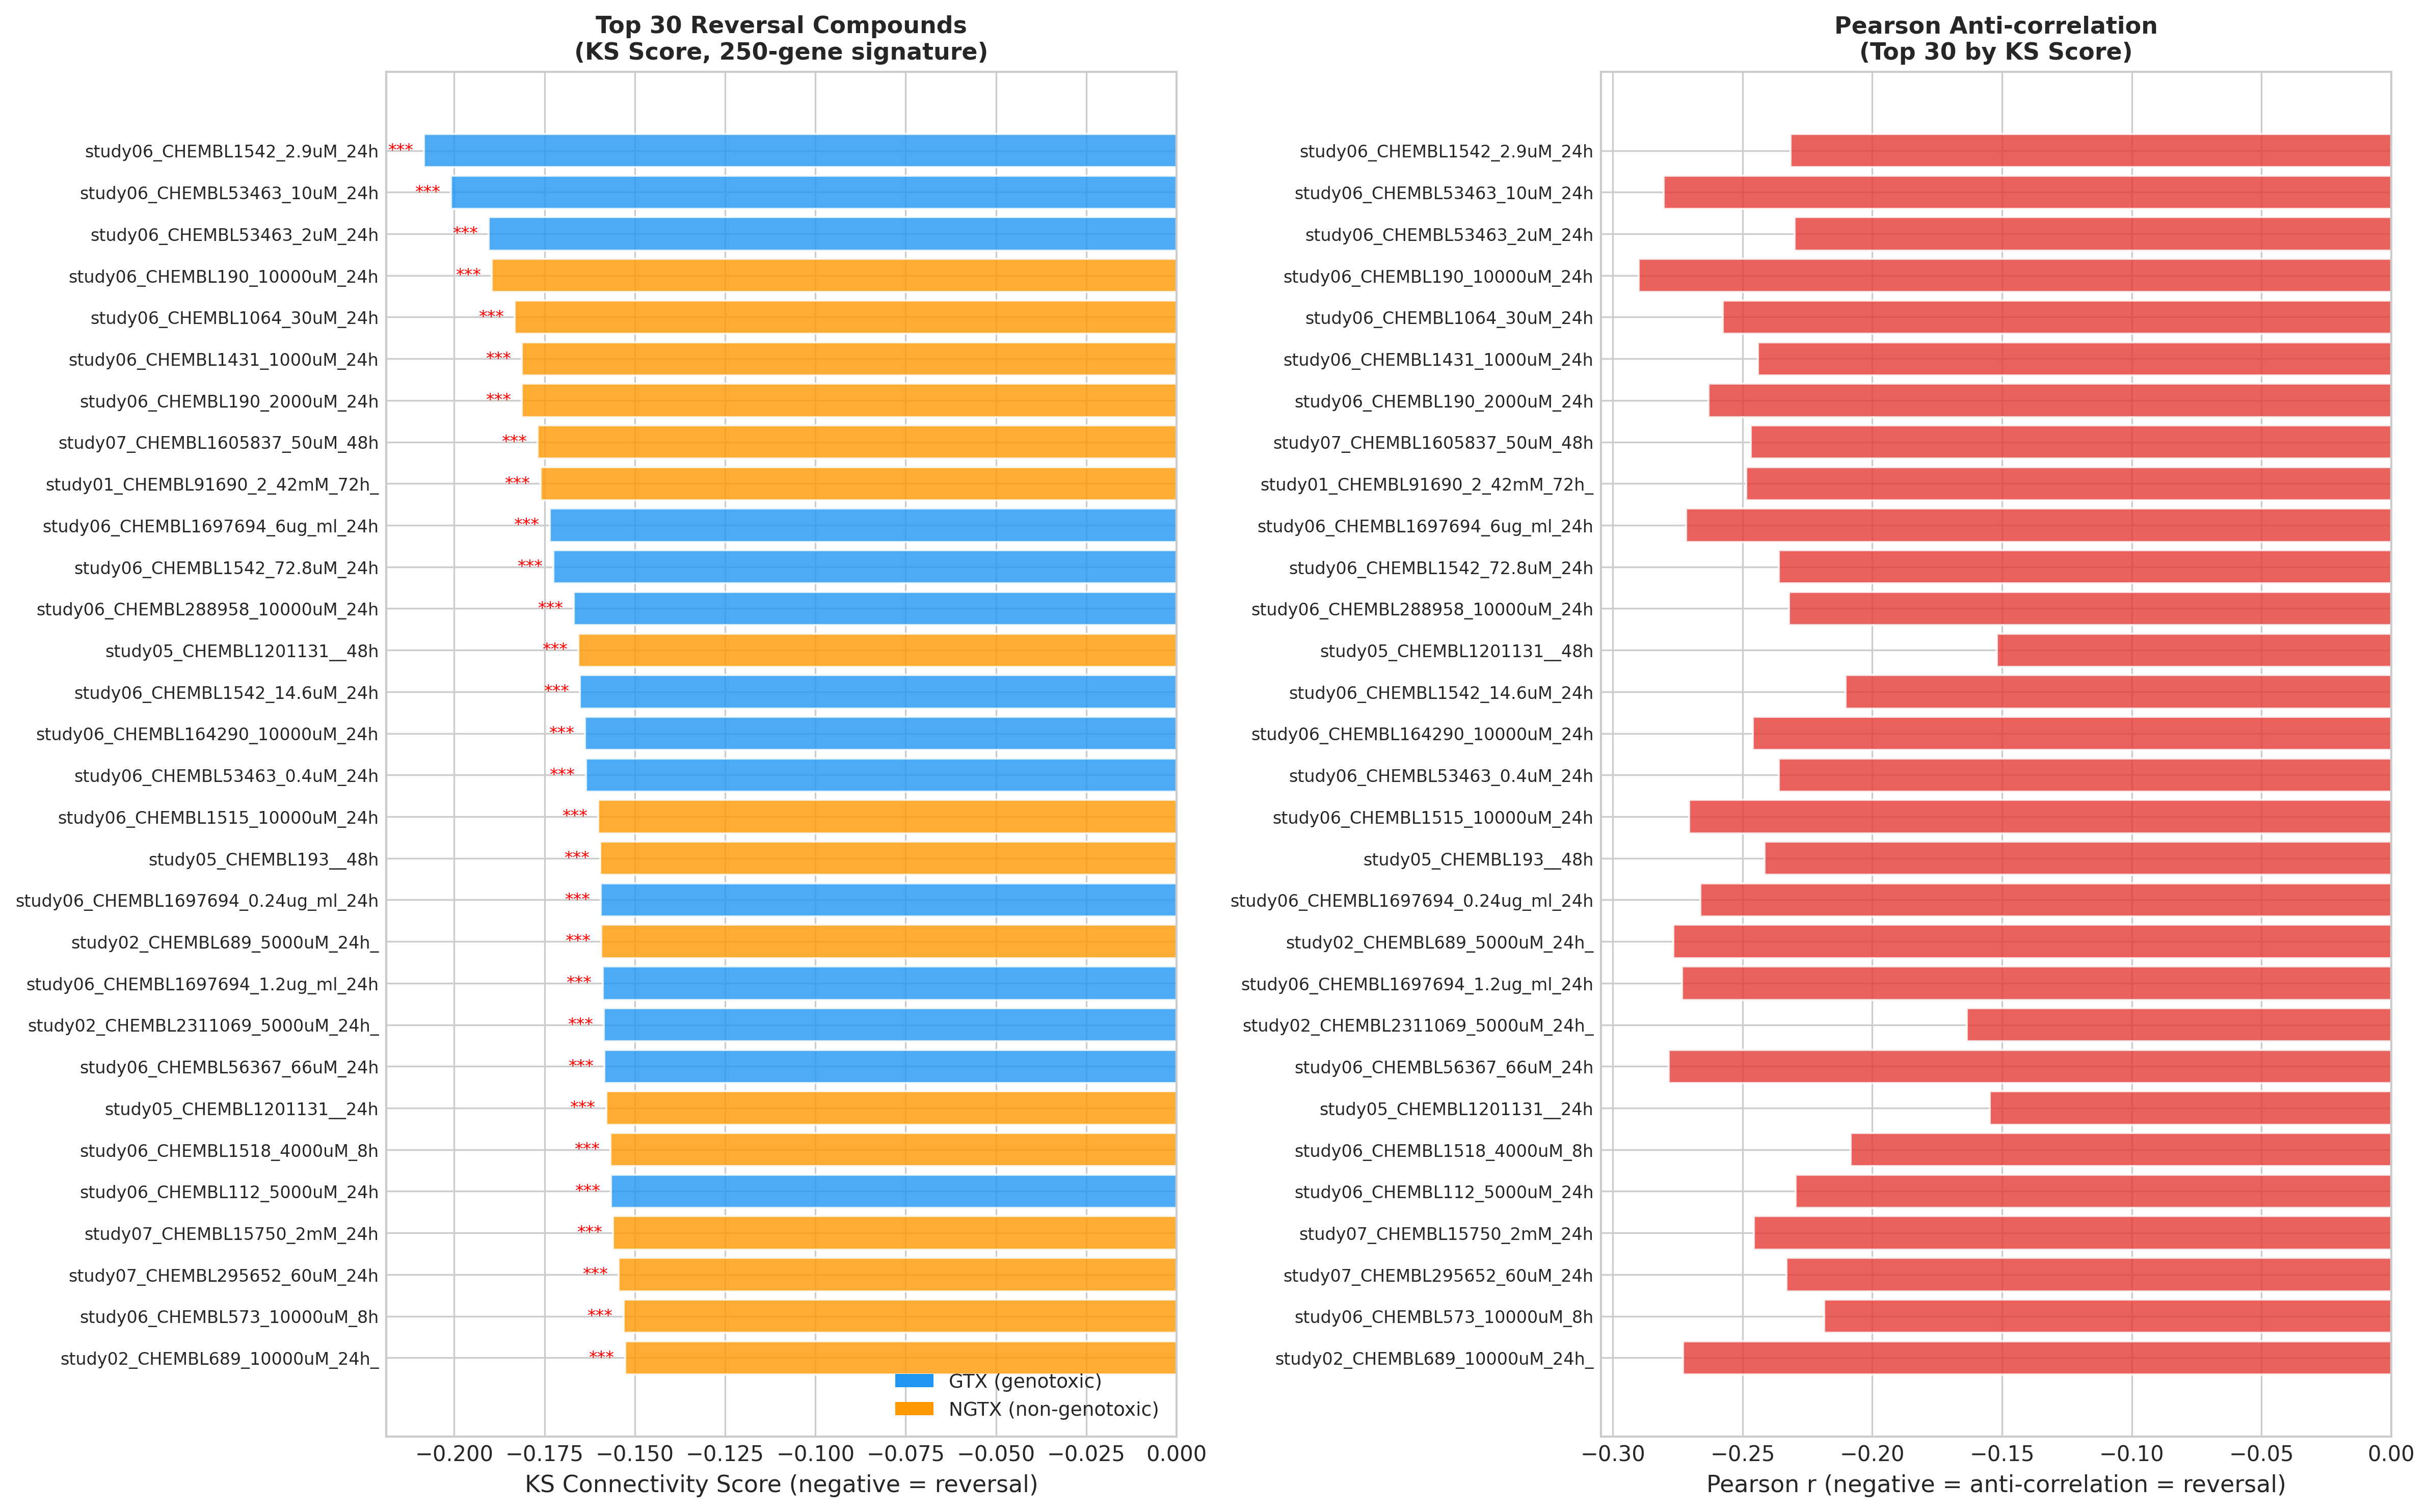
CMap-style reversal scoring on the OpenRiskNet compendium
Querying 128 unique compounds against the NASH signature identified:
| Rank | Compound | Reversal score | Notes |
|---|---|---|---|
| 1 | Theophylline | −0.313 | Non‑selective PDE inhibitor + adenosine antagonist |
| 3 | Doxorubicin | n/a | Cytotoxic confounder |
| 4 | Aflatoxin B1 | n/a | Cytotoxic confounder |
| 10 | Simvastatin | n/a | 92nd percentile: positive control passes |
| 16 | Metformin | n/a | 88th percentile: positive control passes |
| 38 | Dexamethasone | n/a | Negative control correctly outside top quartile |
| 40 | Valproic acid | n/a | Negative control correctly outside top quartile |
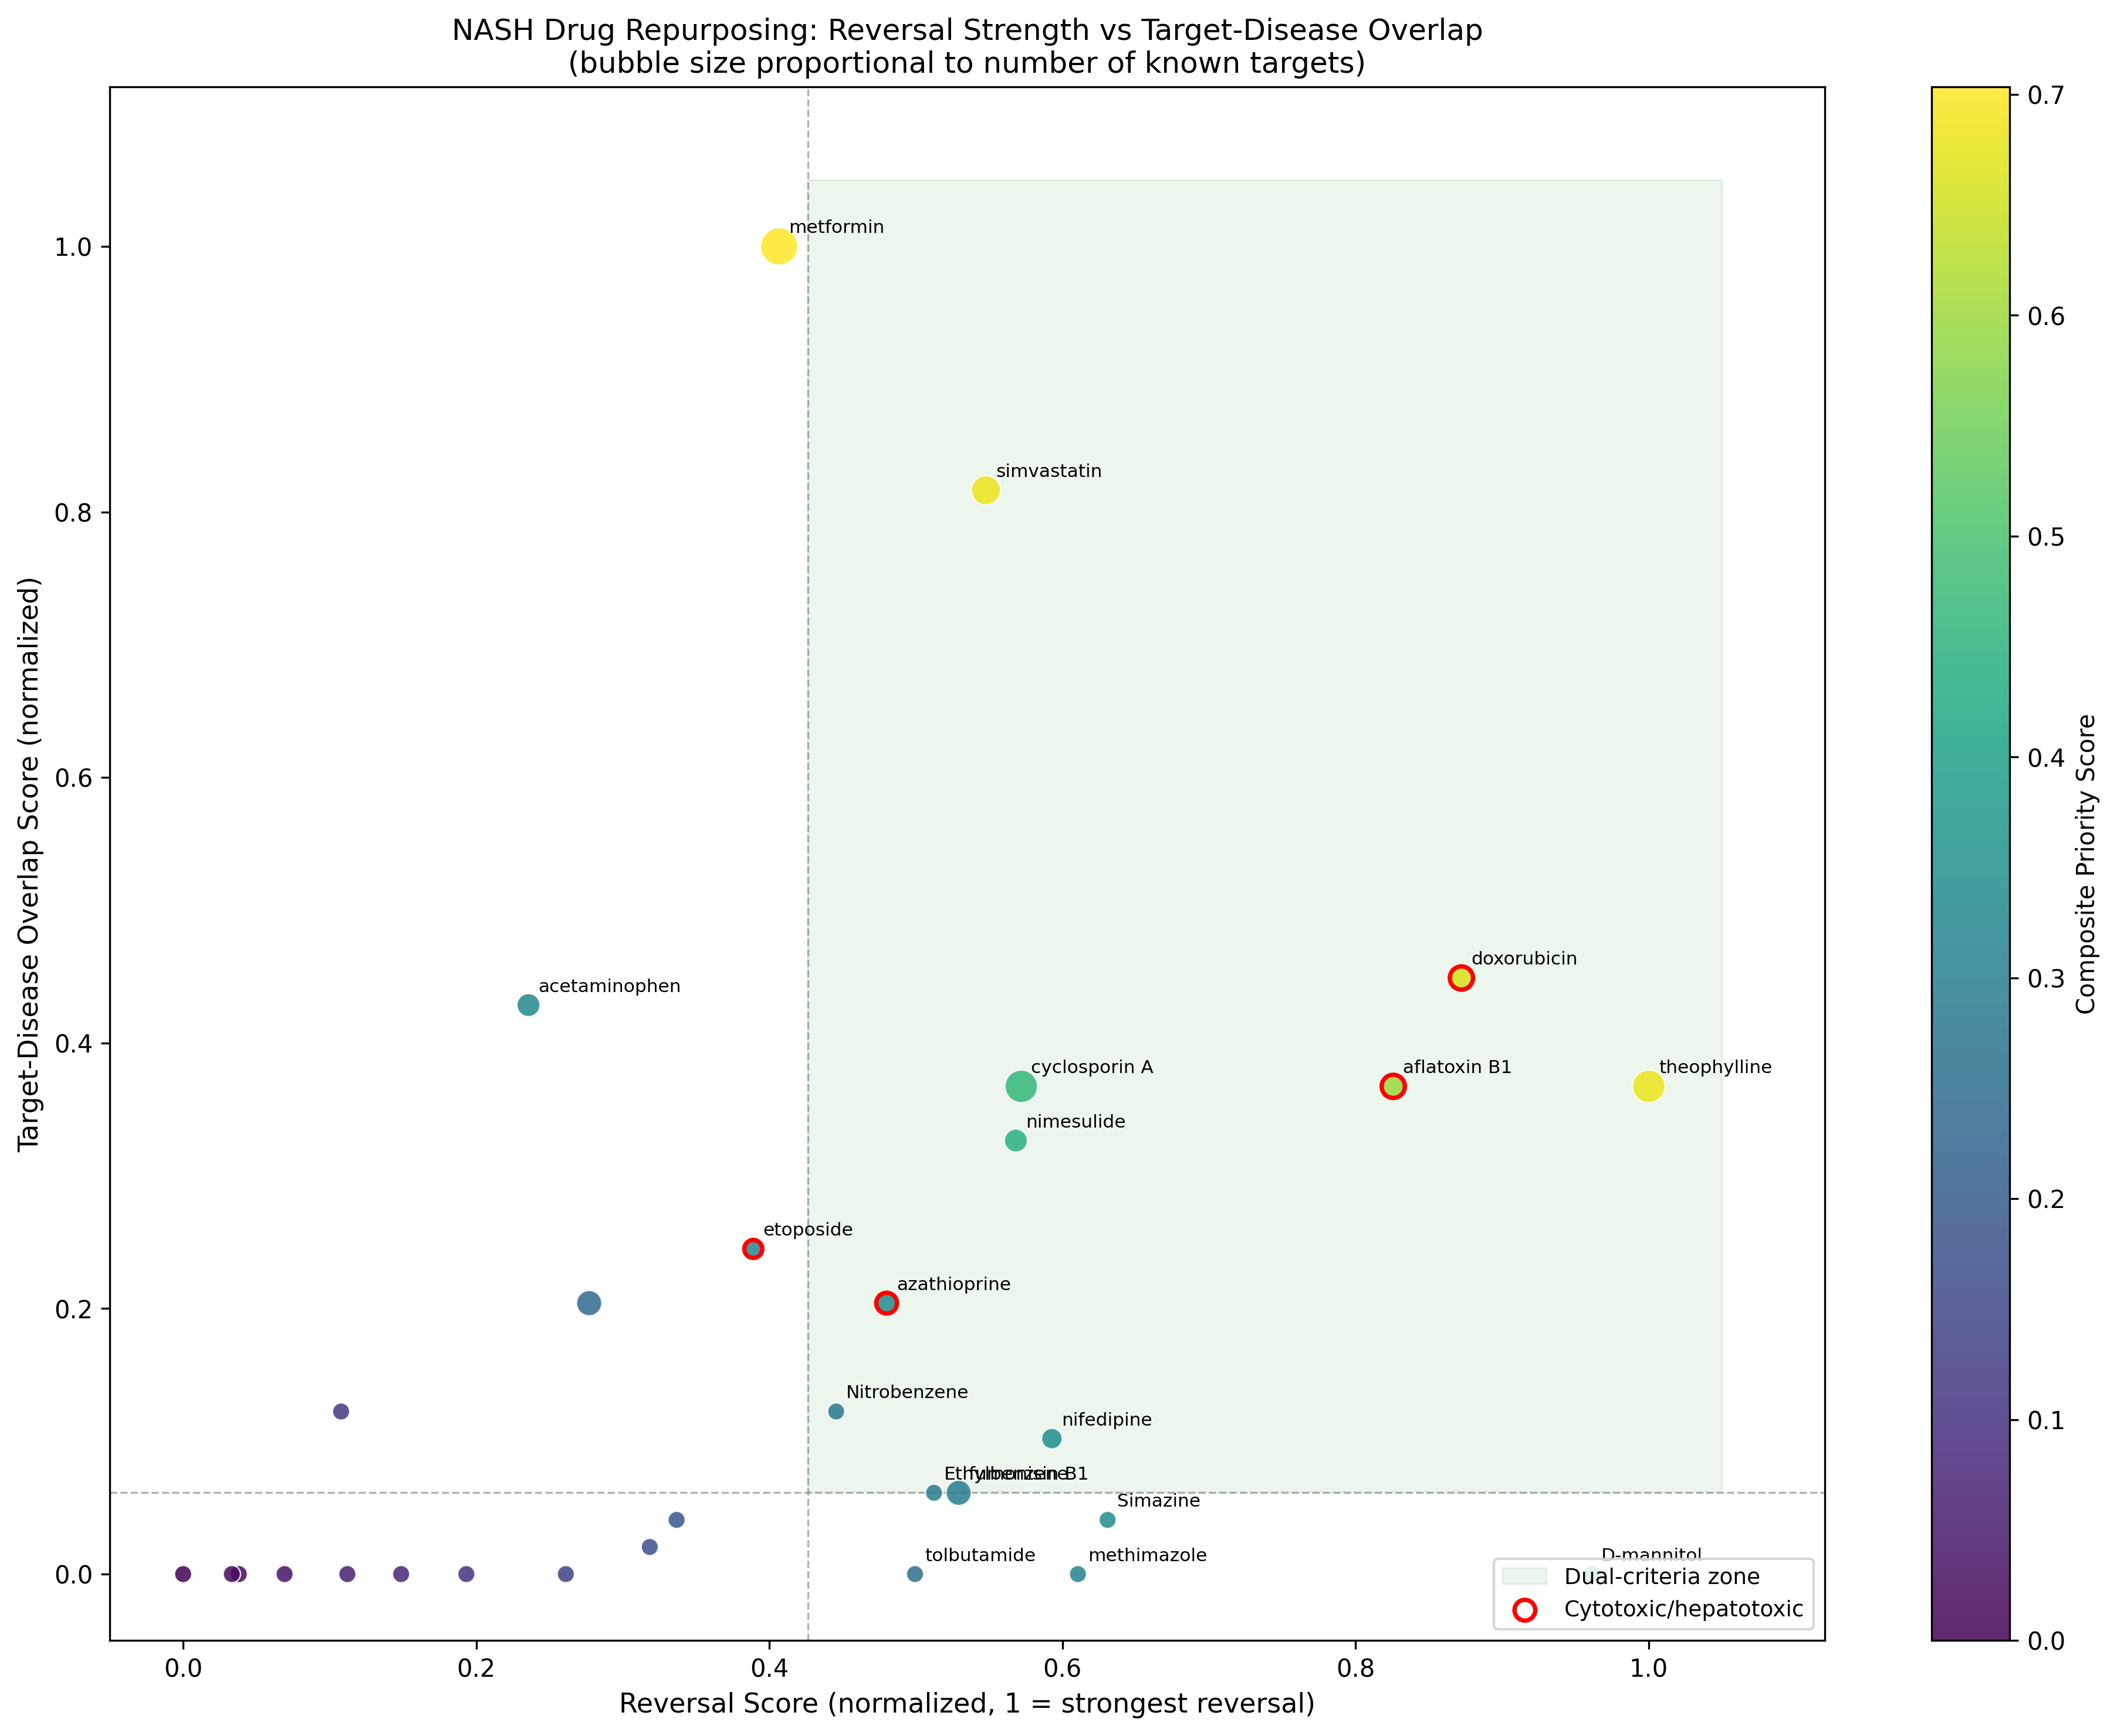
The negative/positive control behaviour validates the methodology. Metformin's #1 composite score (0.703) directly contradicts its failure in multiple NASH histology RCTs, a brutally honest finding the pipeline surfaces rather than hides.
Run 2: Doing the chemistry homework on the top hit
Theophylline is biologically plausible (PDE4 + A-receptor) but pharmacologically messy. Run 2 asks: can we find a clean PDE4 inhibitor that captures theophylline's transcriptional reversal without its off-target liabilities?
A SAR landscape of 567 PDE4 inhibitors
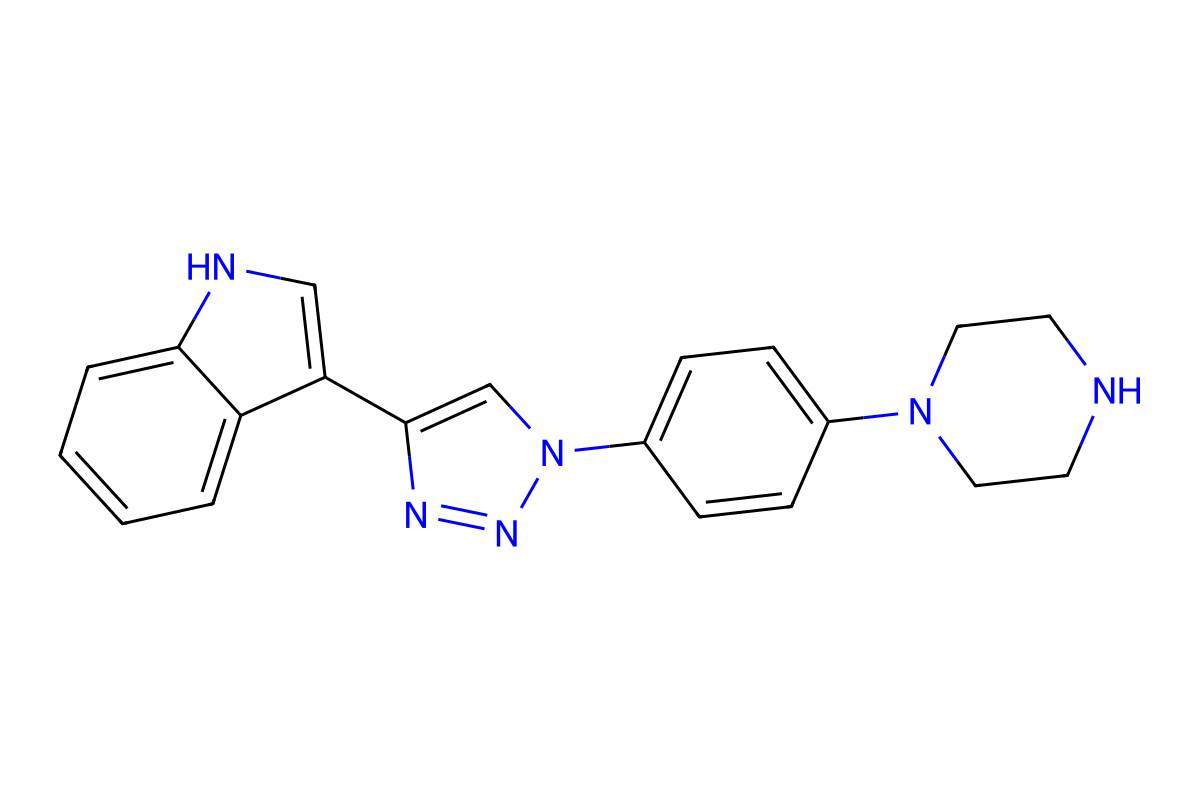
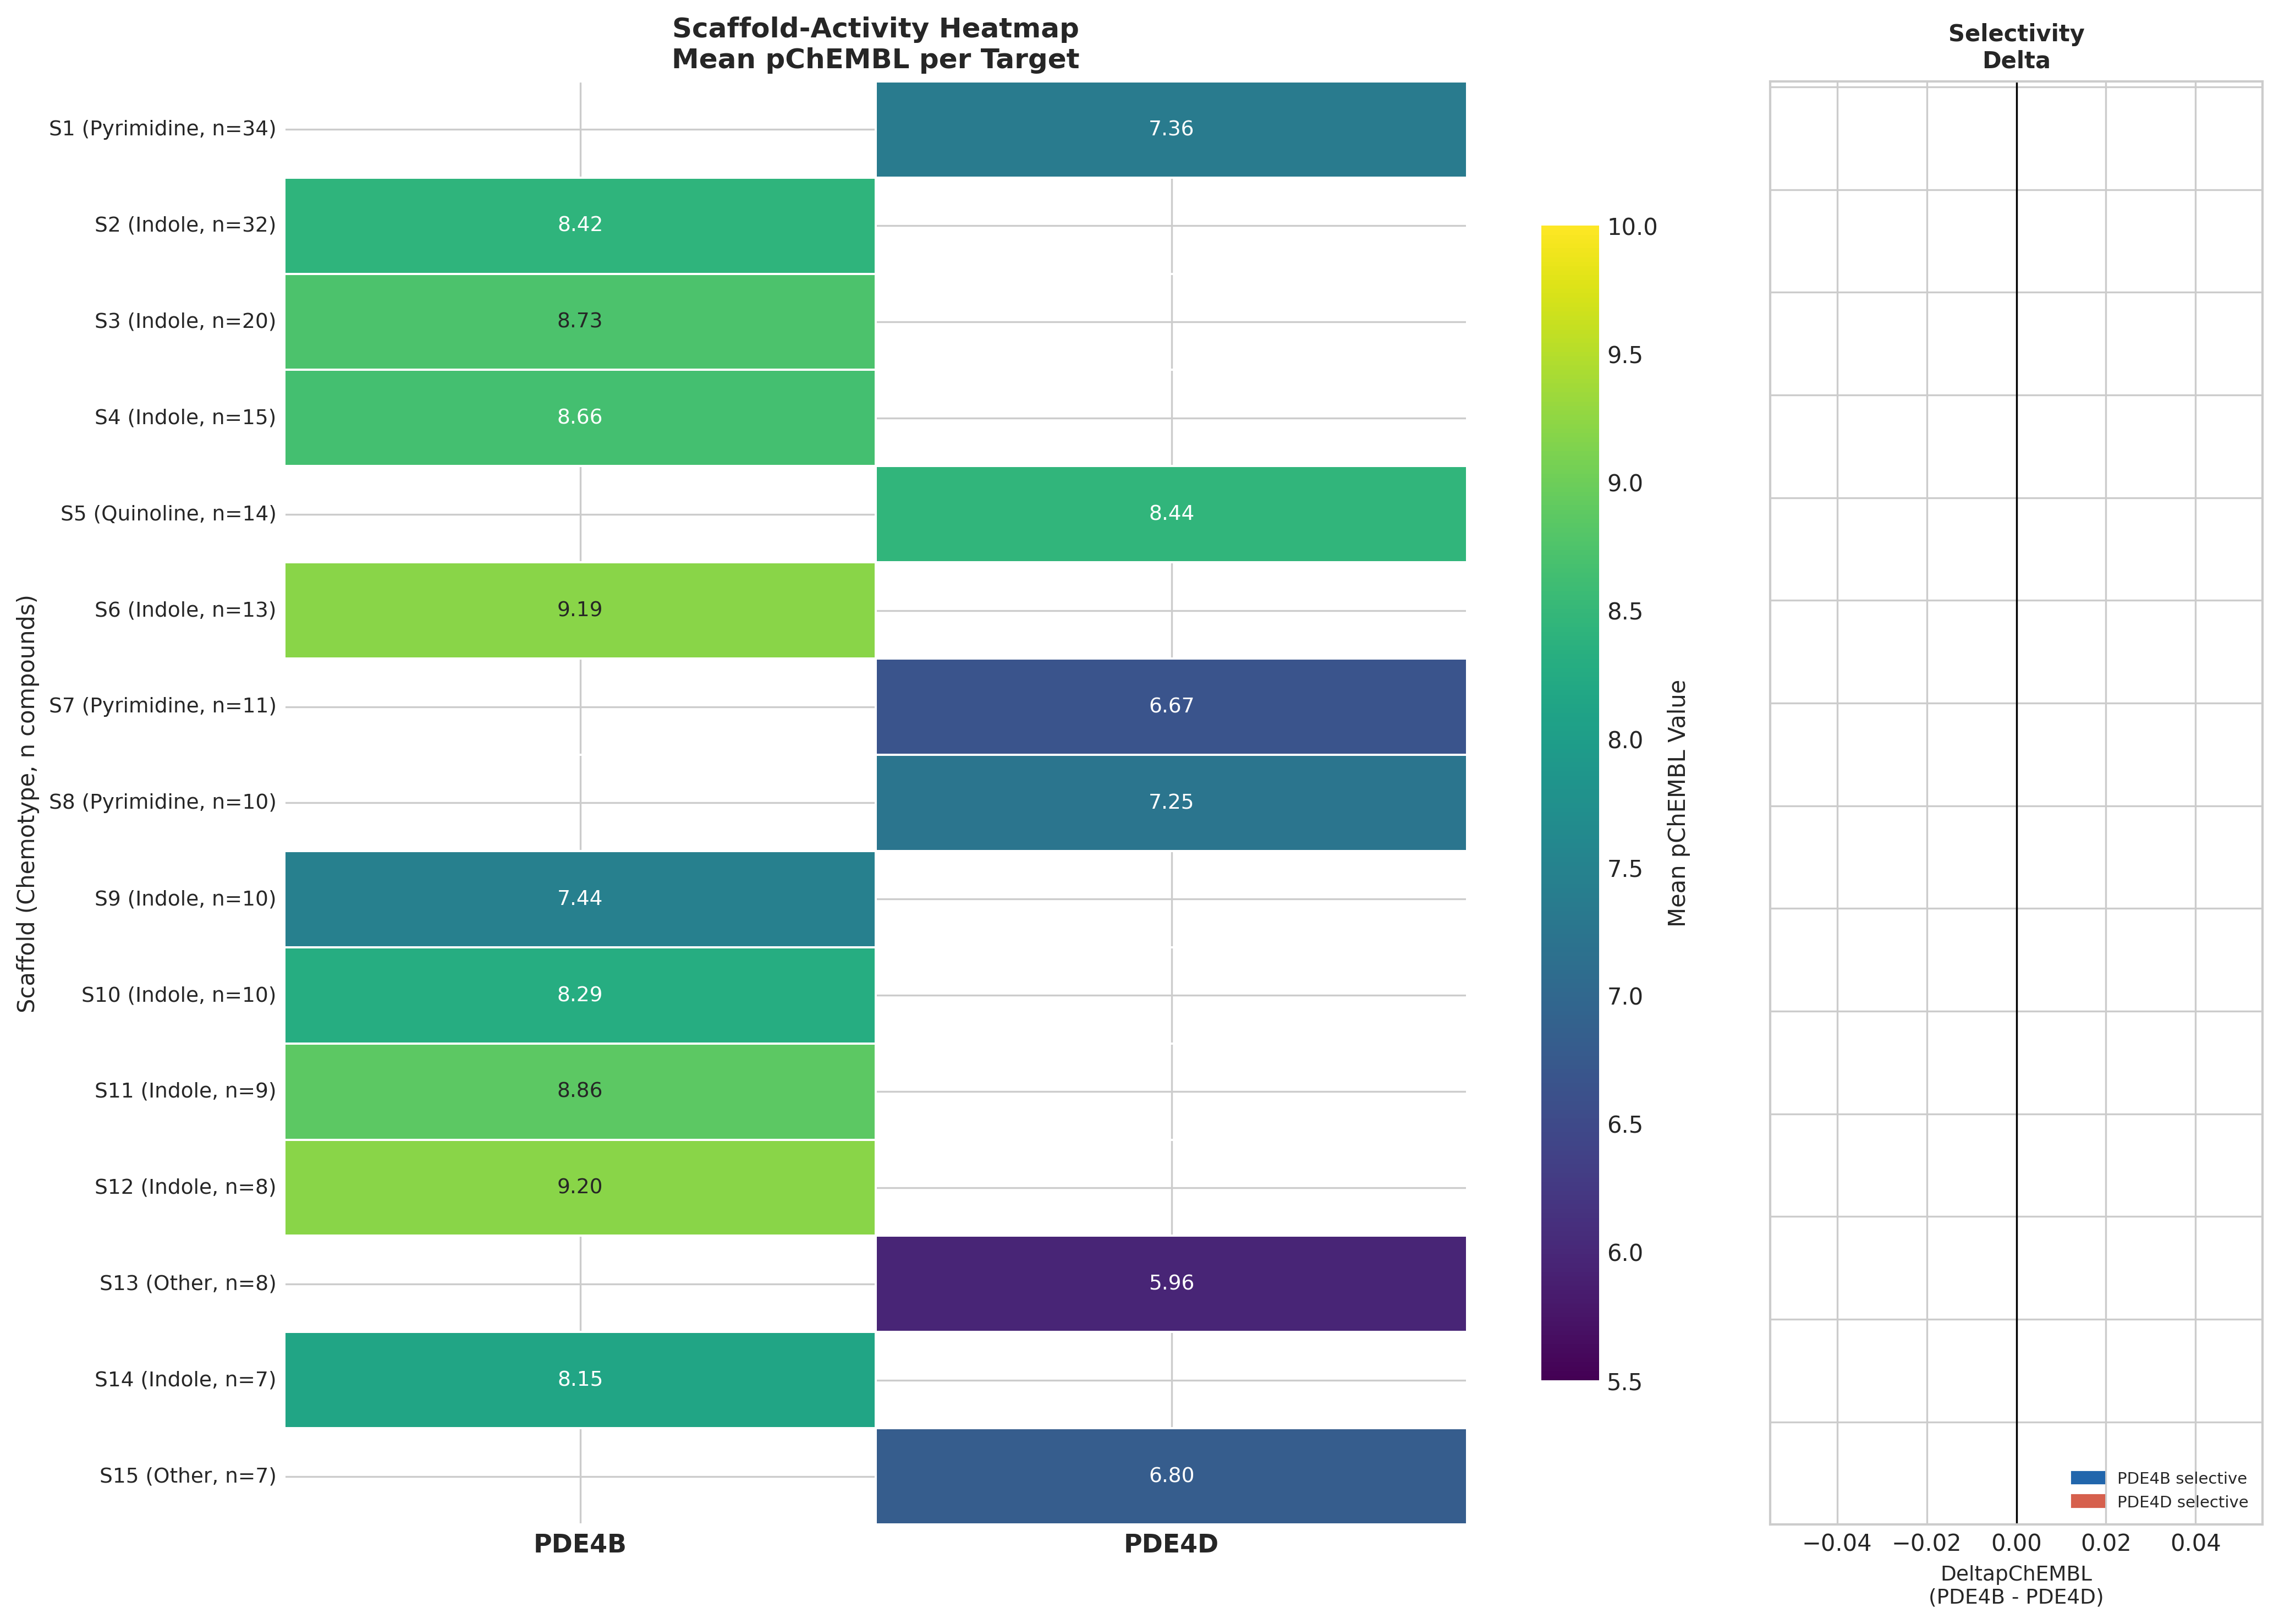
Murcko scaffold decomposition across the ChEMBL set gave 272 unique scaffolds. Indole-triazole-piperazine/piperidine variants dominate PDE4B activity (~130 compounds, mean pChEMBL 7.4–9.2, best 10.0 ≈ 0.1 nM). Strikingly, every top-15 scaffold is exclusively PDE4B or PDE4D, with no scaffold-level dual activity. 43 activity-cliff pairs (SALI > 10) were detected; the steepest cliff in PDE4B reached SALI 130.5.
PubMed searches for "indole-triazole-piperazine PDE4" return zero hits: this is likely a proprietary patent series surfacing in ChEMBL. PDE4B-selective inhibition in fibrotic lung disease is independently validated by nerandomilast, a thienopyrimidine PDE4B inhibitor with Phase 3 success in IPF (Richeldi et al. 2025, NEJM).
Off-target screening: a clean adenosine receptor profile
Zero of 567 PDE4-active compounds have recorded pChEMBL ≥ 5 activity against any adenosine receptor (ADORA1/2A/2B/3) in ChEMBL. This is a strong (if absence-of-evidence-caveated) signal that selective PDE4 chemistry can in principle separate cleanly from theophylline's A-receptor pharmacology.
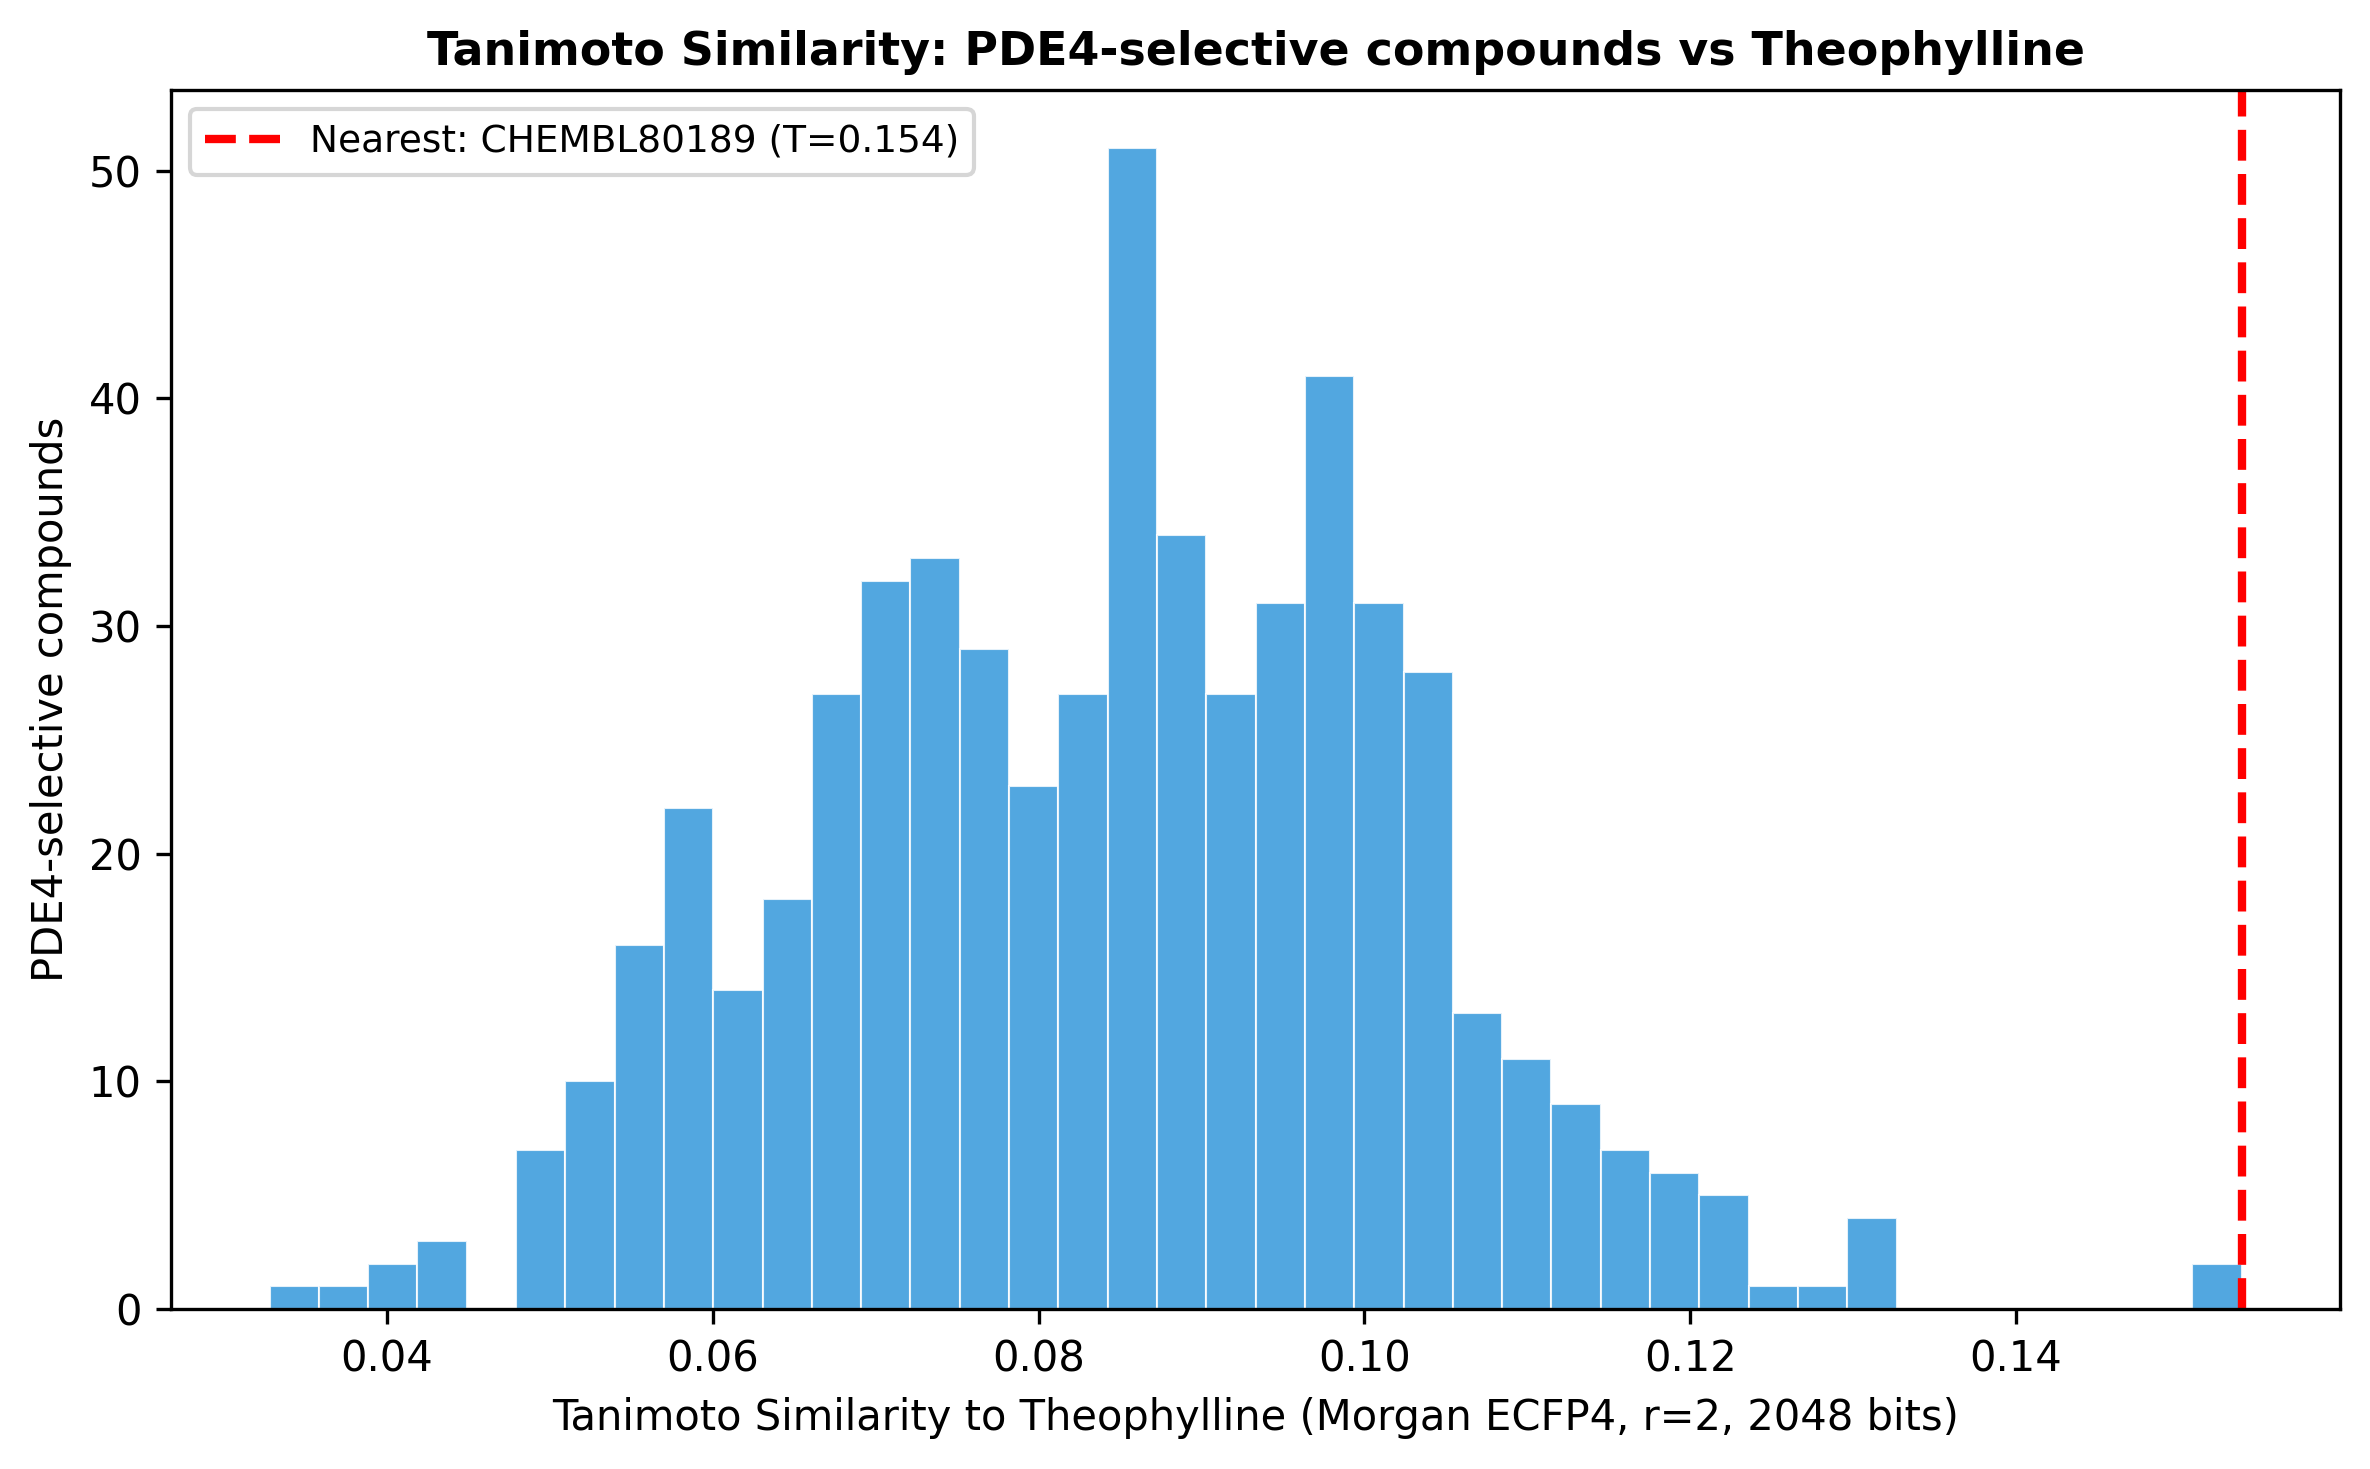
Theophylline lives in a different chemical universe
Tanimoto comparison of theophylline against the entire PDE4-selective set yielded maximum similarity 0.154 (i.e., there is no near-neighbour PDE4 inhibitor structurally resembling theophylline). The reversal signal is mechanism-driven, not chemistry-driven.
The critical isoform selectivity gap
Here the pipeline does something genuinely useful: it flags its own internal contradiction.
- The strongest mechanistic NASH evidence implicates PDE4D (hepatocyte steatosis via CD36-TGFβ1).
- The recommended top scaffolds from this SAR landscape are PDE4B-selective (inflammation / Kupffer-cell TNF).
- Theophylline's anti-fibrotic activity may partially derive from A2A blockade on hepatic stellate cells, an effect a clean PDE4 inhibitor would lose.
So a pure PDE4-selective successor to theophylline could underperform on fibrosis endpoints despite better selectivity. This is the kind of structured hypothesis a downstream wet-lab program can actually act on.
What hypotheses come out of this?
- TIMD4 / efferocytosis loss is upstream of fibrogenic activation in NASH. Restoring Kupffer cell efferocytosis (e.g. via HIF-2α modulation) should reduce SERPINE1/COL1A1-driven fibrosis. (Independently confirmed by PMID 40929246.)
- The obese→NAFLD transition is the dominant transcriptomic inflection point, not NAFLD→NASH. Early intervention windows may sit before histological steatosis.
- P4HA1 early suppression is a novel pre-steatosis biomarker hypothesis with no prior literature support.
- ZC3H13-centred m6A dysregulation is a candidate upstream mechanism for downstream NASH metabolic and splicing phenotypes.
- A PDE4B-selective indole-triazole-piperidine compound could replicate theophylline's anti-inflammatory reversal but would need PDE4D activity (or A2A-independent anti-fibrotic add-on) to match theophylline's fibrosis effect.
- Metformin's high composite reversal score is a cautionary finding, not a candidate; it concretely demonstrates the gap between transcriptome reversal and human histology.
Why the analytical depth matters
What distinguishes this pipeline from a one-shot CMap query:
- Independent positive/negative controls were prespecified (simvastatin, metformin / dexamethasone, valproic acid) and behaved correctly.
- The pipeline contradicts itself out loud: metformin's #1 ranking is reported alongside the RCT evidence that refutes it (PMID 22278337, 34400208).
- Findings are explicitly graded as confirmed / partially confirmed / novel / contradicted, with PMID-level literature concordance.
- The chemistry follow-up exposes a target-isoform mismatch (PDE4D vs PDE4B) that a transcriptomics-only analysis would have missed entirely.
- An independent CMap study of the same dataset (PMID 40936782) returned different candidates (WYE-354, Triciribine), and this pipeline reports that pipeline-dependence rather than glossing over it.
The output of computational repurposing should look like this: a ranked list, a mechanism, a chemistry plan, and a written list of how each step could be wrong.
Interested in this kind of analysis?
See how Inflexa runs multi-stage pipelines from raw data to structured hypotheses.