From 406 compounds to 26 translational leads: an end-to-end DRUG-seq dose-response decoder
Rebuilding the analytical pipeline on Ginkgo Datapoints' GDPx4 DRUG-seq screen — from raw count matrix to tiered, target-annotated compound hypotheses.
Ginkgo Datapoints GDPx4 DRUG-seq screen: 406 compounds × 6 doses (0.03–10 µM) in synchronised HEK293 across 14 plates, with four positive-control anchors (BFA, TSA, Rigosertib, Staurosporine) and DMSO sham wells. Raw matrix 78,778 × 5,264 wells.
High-throughput transcriptomic screens are a chemical biologist's dream and a translational lead's nightmare. They are dense, plate-confounded, replicate-poor, and stuffed with cytotoxic noise. The promise — recover mechanism of action (MoA) and rank compounds by the cleanliness of their dose-response — is real, but realising it requires a pipeline that holds together from raw count to target nomination.
We rebuilt that pipeline end-to-end on the Ginkgo Datapoints GDPx4 dataset. The 78,778 × 5,264 raw matrix went through seven analytical steps and emerged as a tiered, target-annotated, indication-mapped table of compound hypotheses. This post walks through what the analysis found, what it concluded, and — most importantly for biopharma readers — what those conclusions mean for translational decision-making.
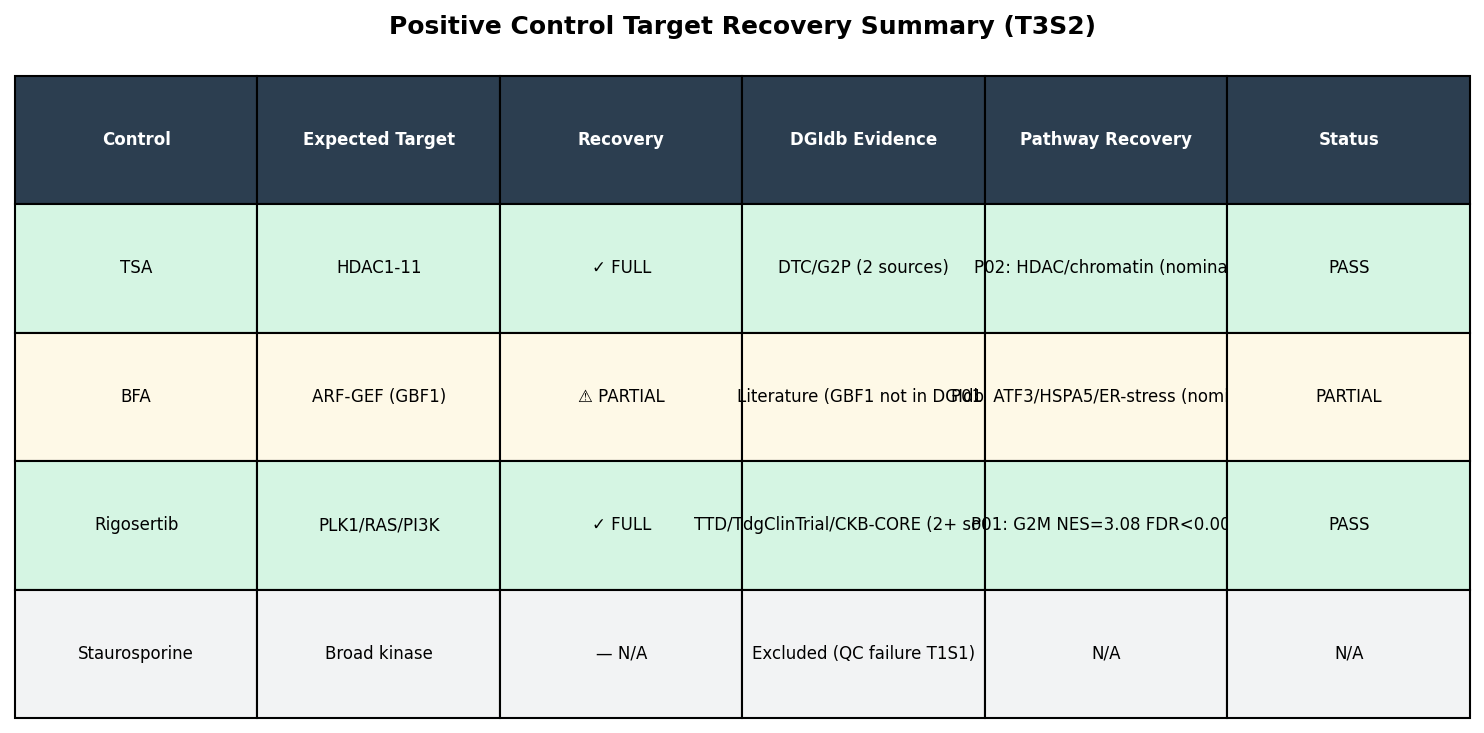
- Analytical validity is established. Three of four positive controls (BFA → UPR, TSA → HDAC chromatin, Rigosertib → PLK1/cell-cycle) were independently recovered through five orthogonal computational routes. Staurosporine's complete QC failure is itself a biological readout (apoptosis-driven mitochondrial RNA release).
- 26 Tier-1 compounds survive the conjunctive filter of clean dose-response × coherent MoA cluster × multi-source target evidence. These are the highest-confidence leads.
- 75 Tier-2 compounds are the novel-MoA hypothesis pool — clean dose-response, but cluster heterogeneity or missing target annotation prevents full triangulation. Ouabain, emetine, mitoxantrone, omaveloxolone lead this list.
- Cluster 12 antimetabolites are systematically under-ranked by monotonicity weighting — the strongest pathway-enrichment signal in the screen sits in Tier 3 because cytostatic plateau-shaped responses are not what the cleanliness score rewards. A structural artefact, not a biological one, with direct implications for how you set up the next screen.
QC, or, why losing Staurosporine is good news
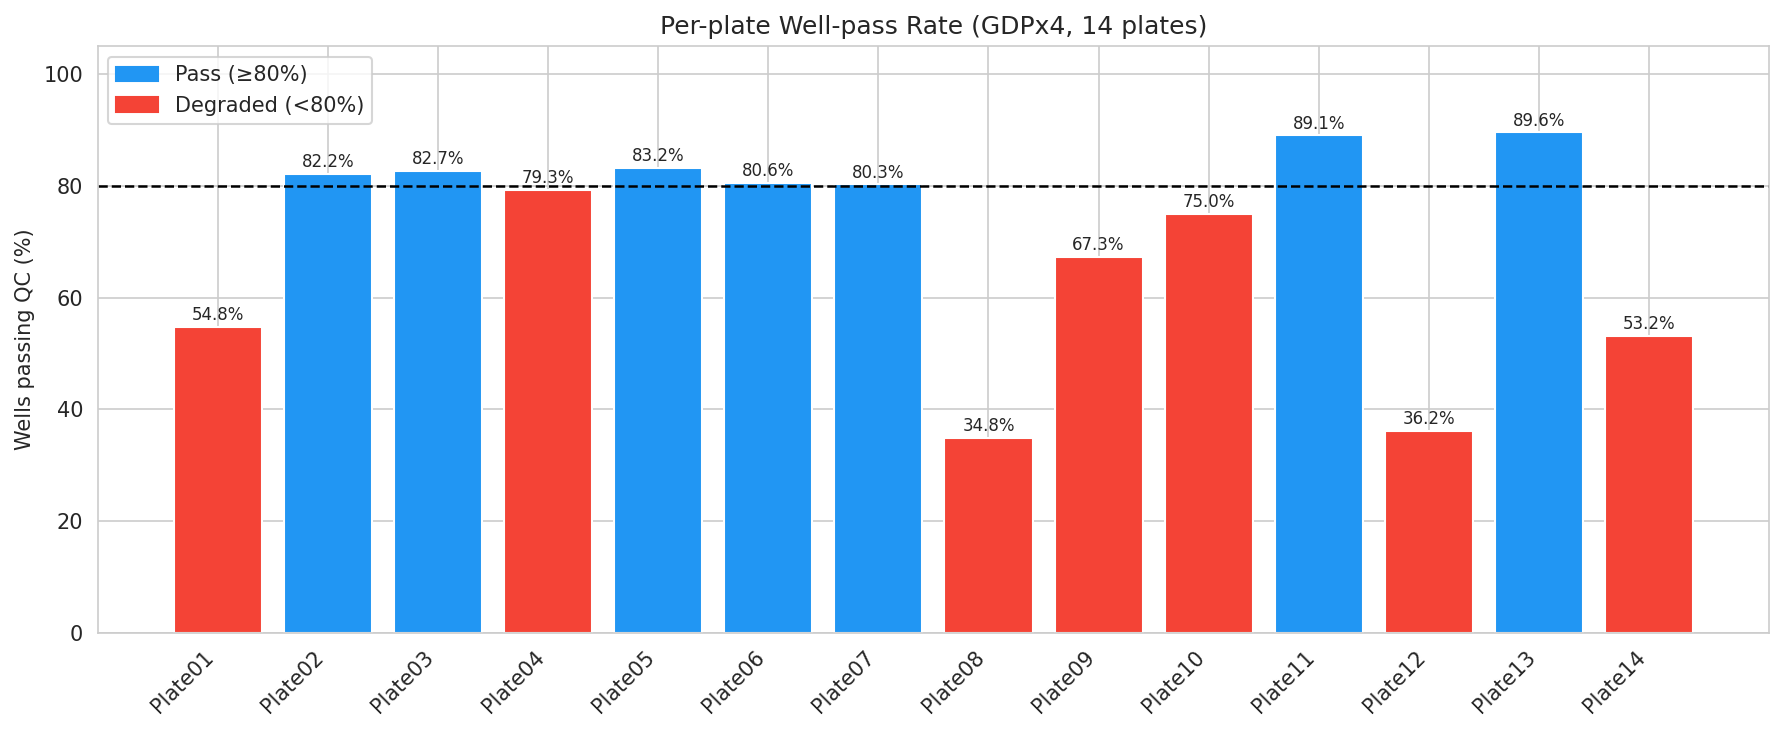
DRUG-seq plates fail in characteristic ways: low UMI counts (sequencing artefact), inflated mitochondrial fraction (cell stress / apoptosis), bimodal duplication (library prep failure). MAD-based thresholds on per-well metrics retained 3,716 of 5,264 wells (70.6%) and isolated 7 systematically degraded plates. Plate08 was a sequencing/alignment failure, Plate12 a library-prep failure, Plate14 multi-modal, plates 01/09/10 high-mito only.
The most diagnostic finding of the QC step is that all 28 Staurosporine wells failed on high mitochondrial fraction. Staurosporine is a pan-kinase inhibitor whose dose range here is overtly apoptotic, and apoptosis releases mitochondrial RNA into the cytoplasm. The QC threshold did exactly what it should — it flagged the wells whose transcriptional state is incompatible with a steady-state DE comparison to DMSO. The "failure" is biology.
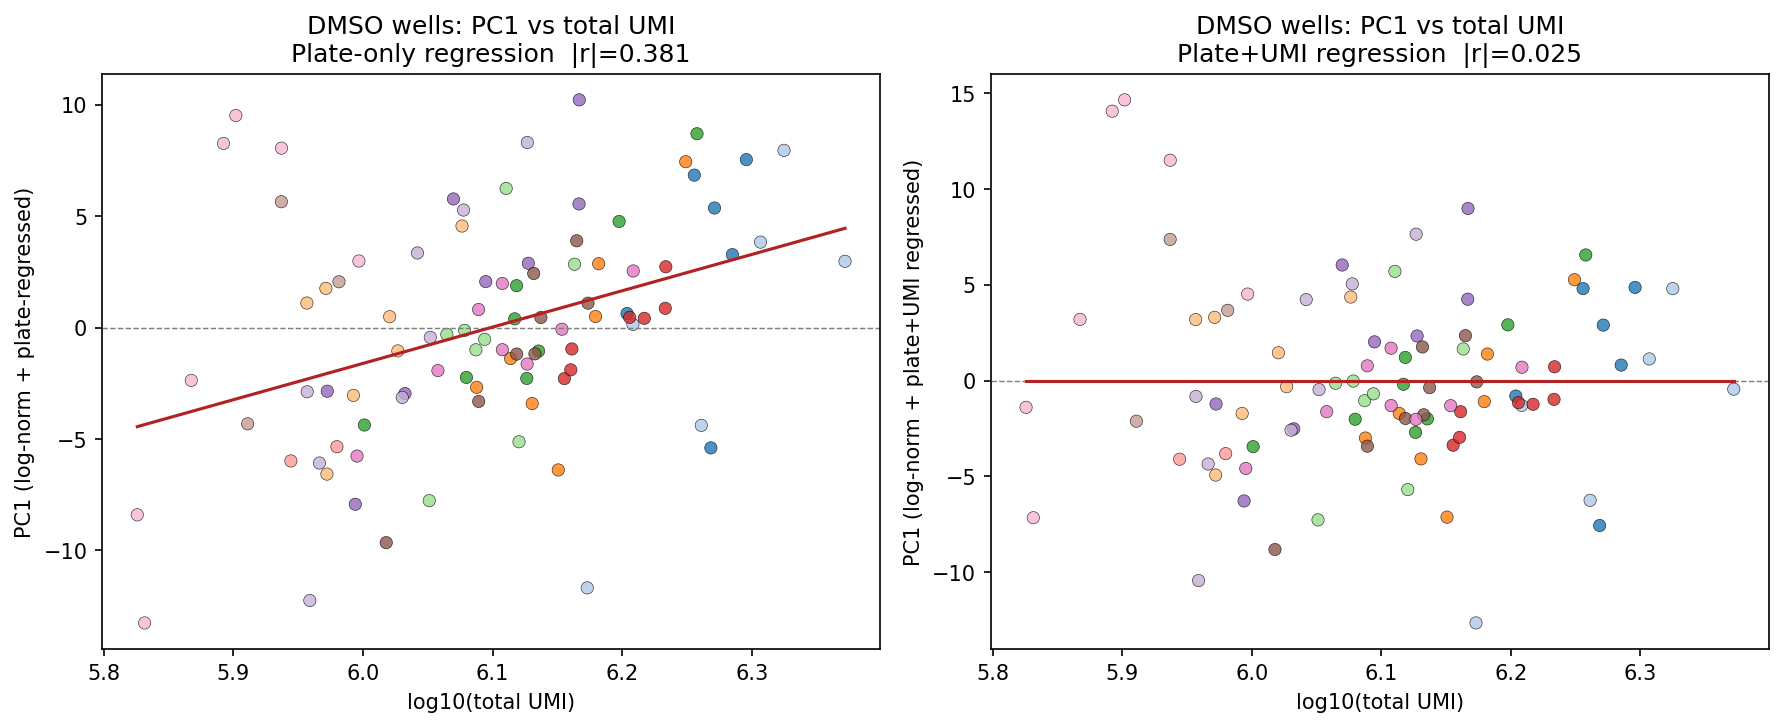
Plate-effect correction (CPM+log1p with OLS plate regression and Pearson-residual VST) collapsed the DMSO PC1–PC2 plate silhouette to –0.39 and dropped |r(PC1, total UMI)| from 0.733 to 0.025. Crucially, UMI regression was not propagated to compound wells — that preserves the cytotoxicity-driven depth signal that some MoAs require.
Per-plate limma-voom recovers canonical biology
A structural feature of the design — each compound occupies exactly one plate — is usually a confound. Here it lets us run per-plate cell-means voom with empirical-Bayes shrinkage on ~181 residual degrees of freedom per plate, eliminating the need for a plate covariate inside any compound contrast. The model produced ~29.1M per-test records (399 compounds × 6 doses × 14,429 genes).
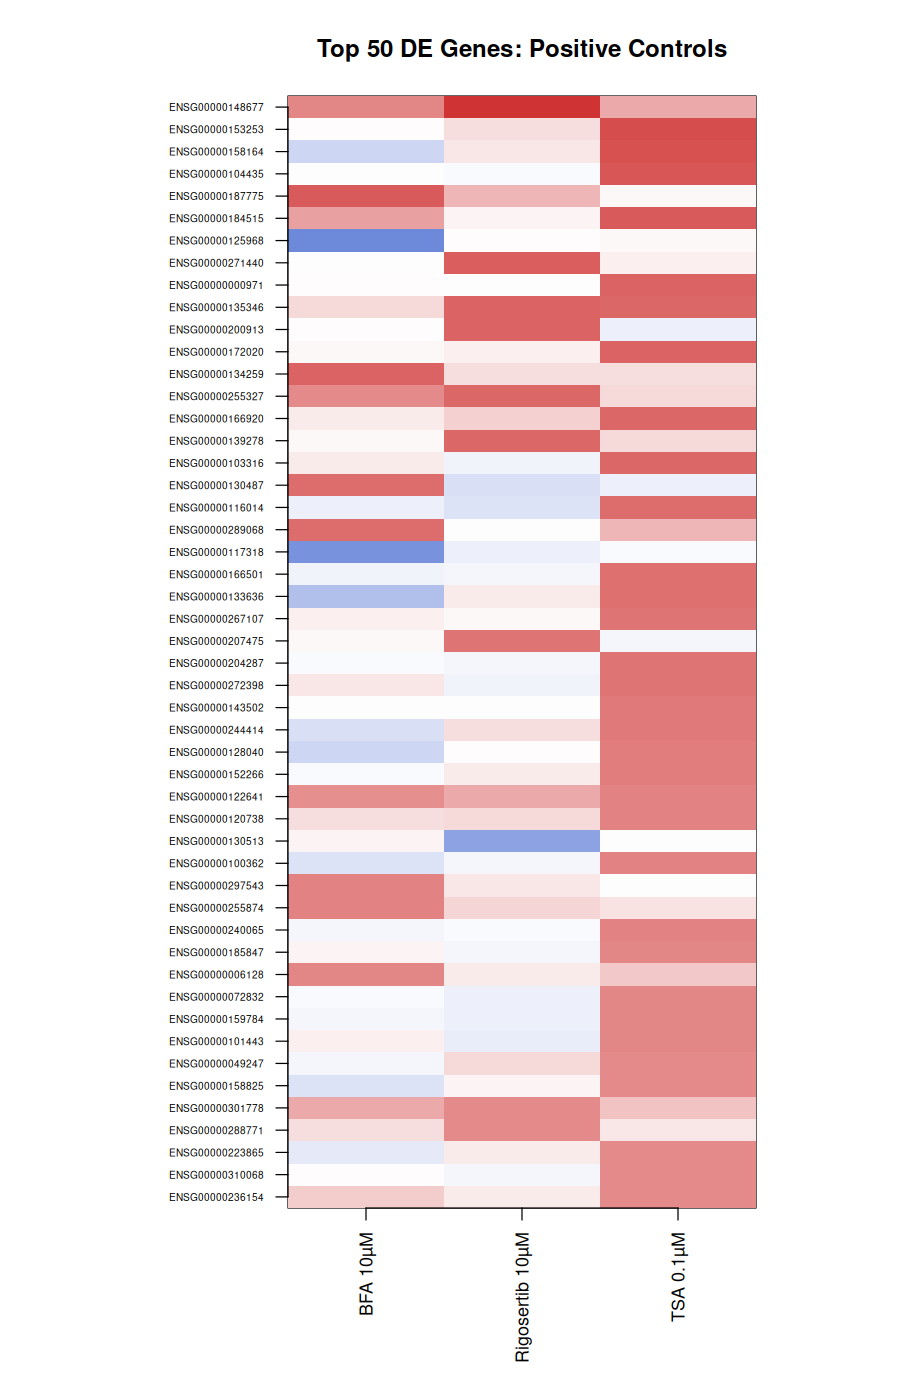
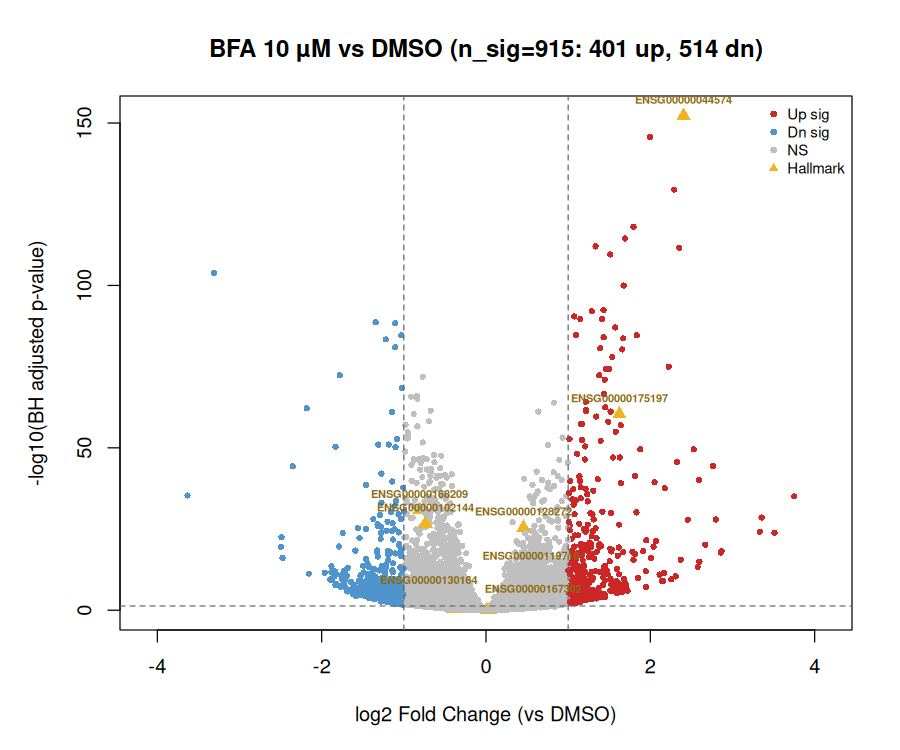
The positive controls came back exactly as the literature predicts:
| Anchor | Best dose | Sig. genes (FDR<0.05) | Hallmark recovery | Canonical interpretation |
|---|---|---|---|---|
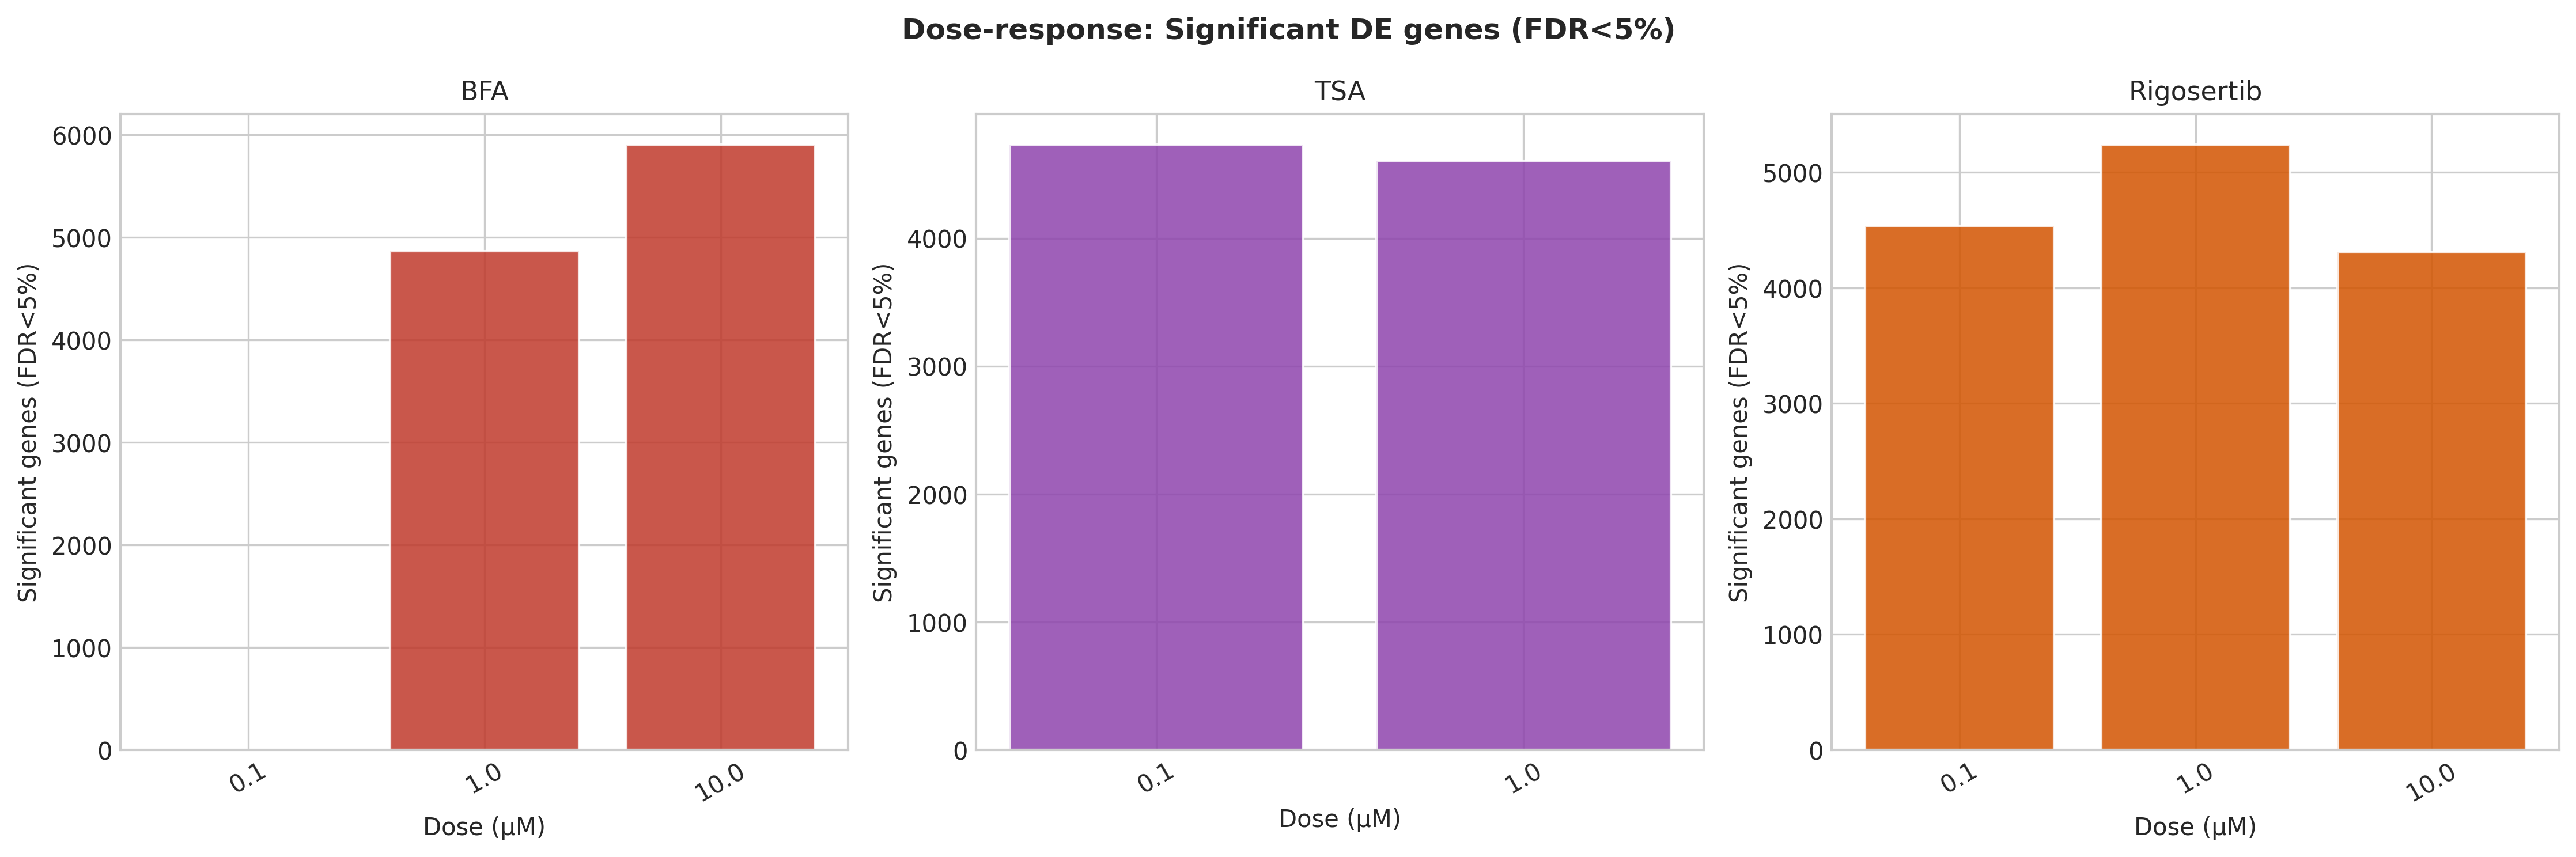
| BFA | 1–10 µM | 4,865–5,907 | HSPA5/BiP, DDIT3/CHOP, ATF3 | UPR / ER stress (ARF-GEF inhibition) |
| TSA | 0.1–1 µM | 4,607–4,733 | HDAC chromatin, CCND1, CDKN1A | Pan-HDAC inhibition |
| Rigosertib | 0.1–10 µM | 4,310–5,242 | PLK1, CCNB1, CDK1, CDC20 | G2/M & PLK1 / cell-cycle |
Each anchor recovered 12–14 of 15 curated hallmark genes. TSA at 10 µM failed QC, consistent with HEK293 cytotoxicity at high HDAC dose.
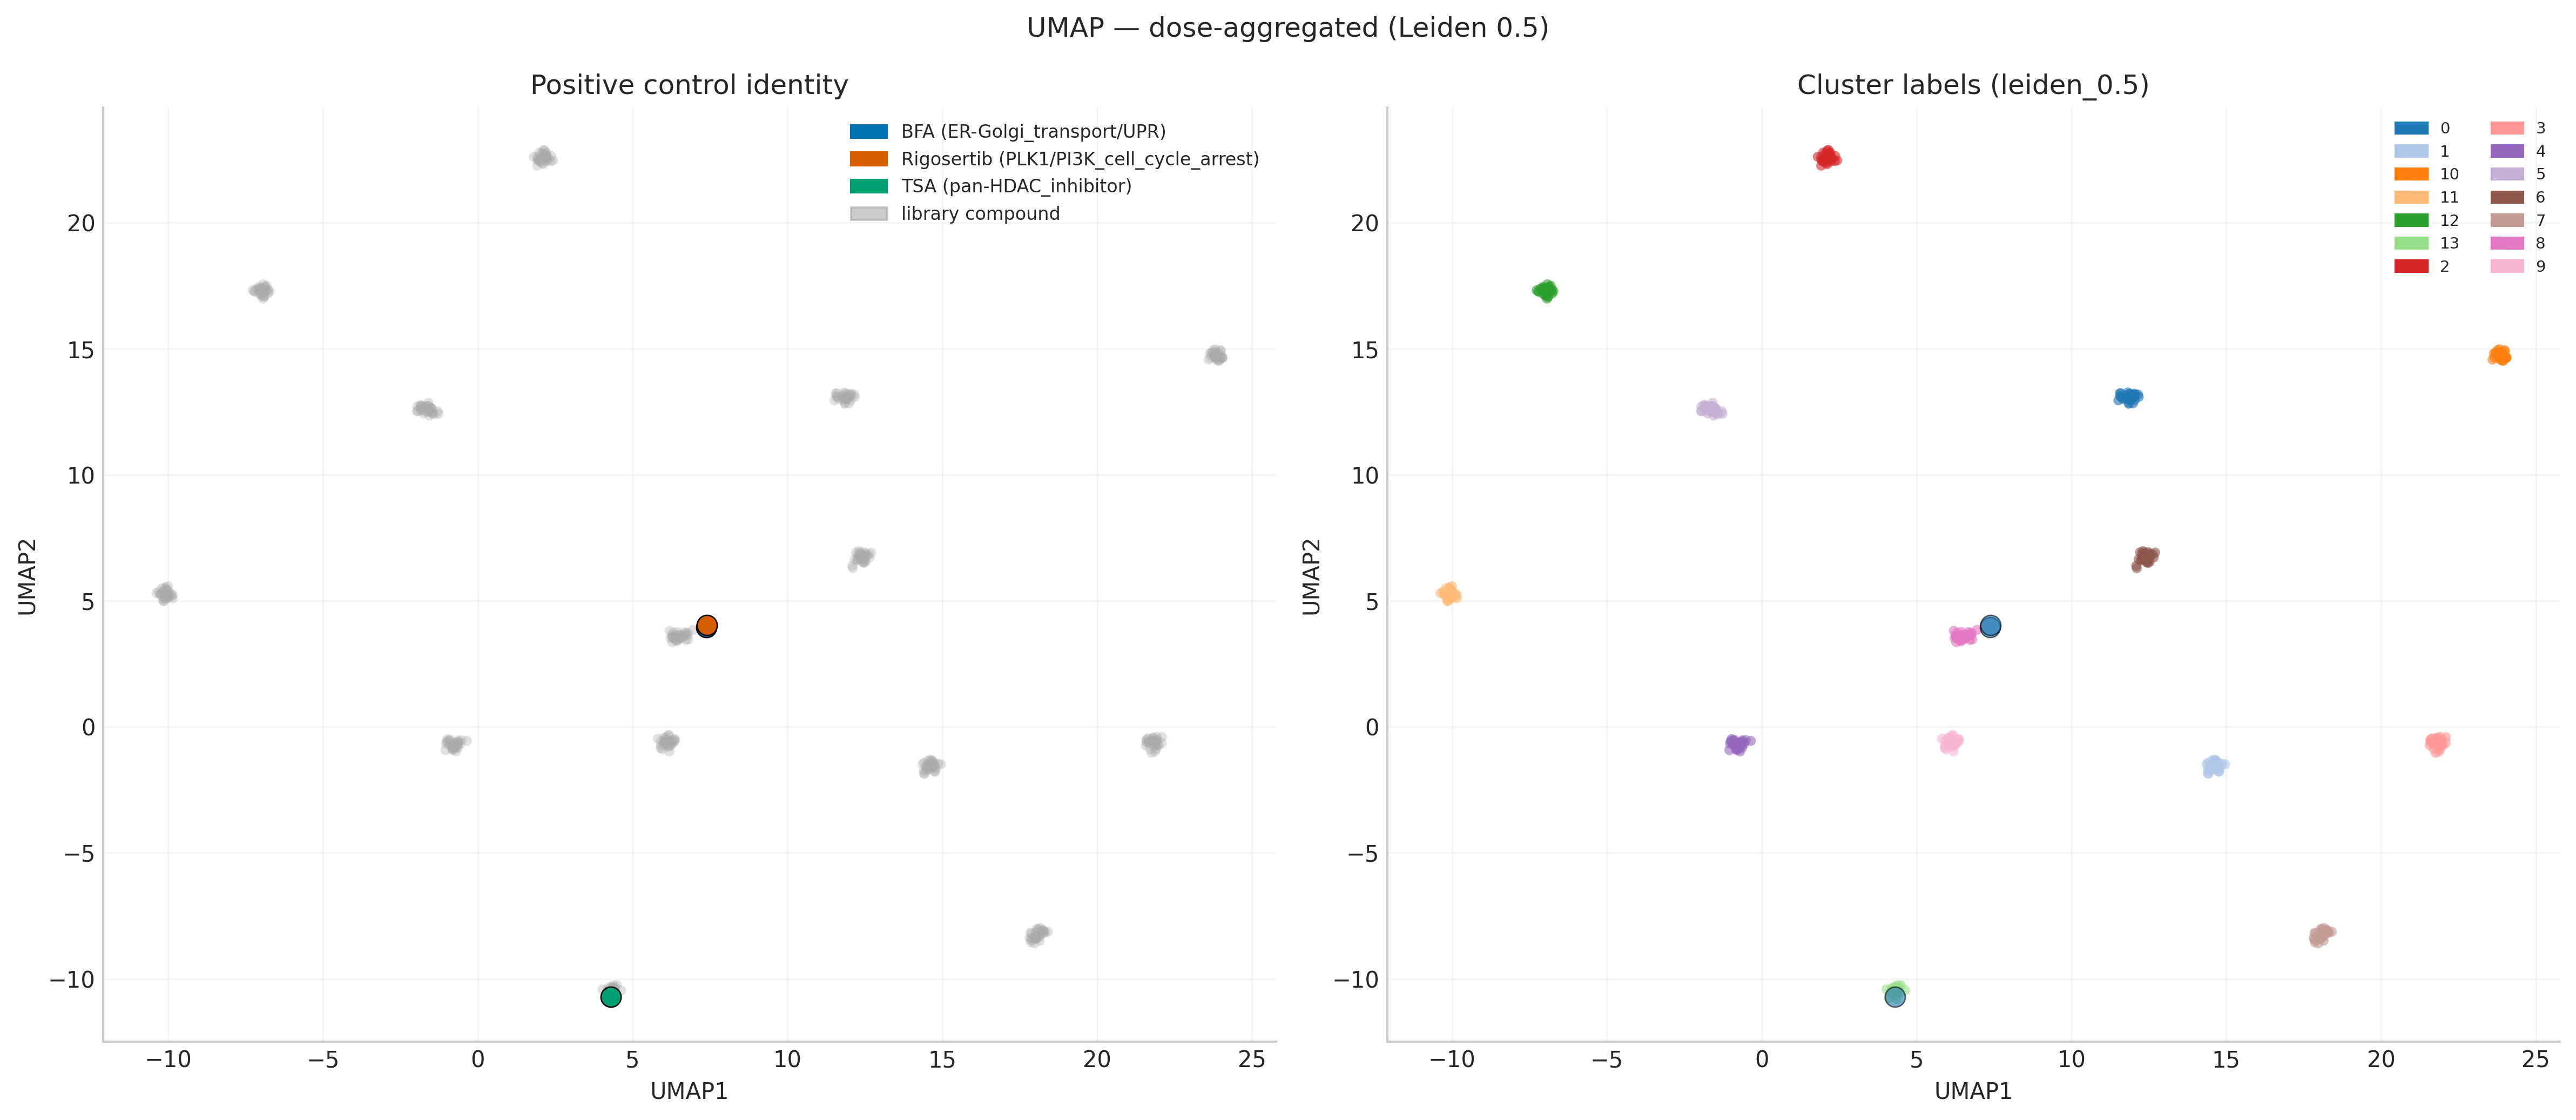
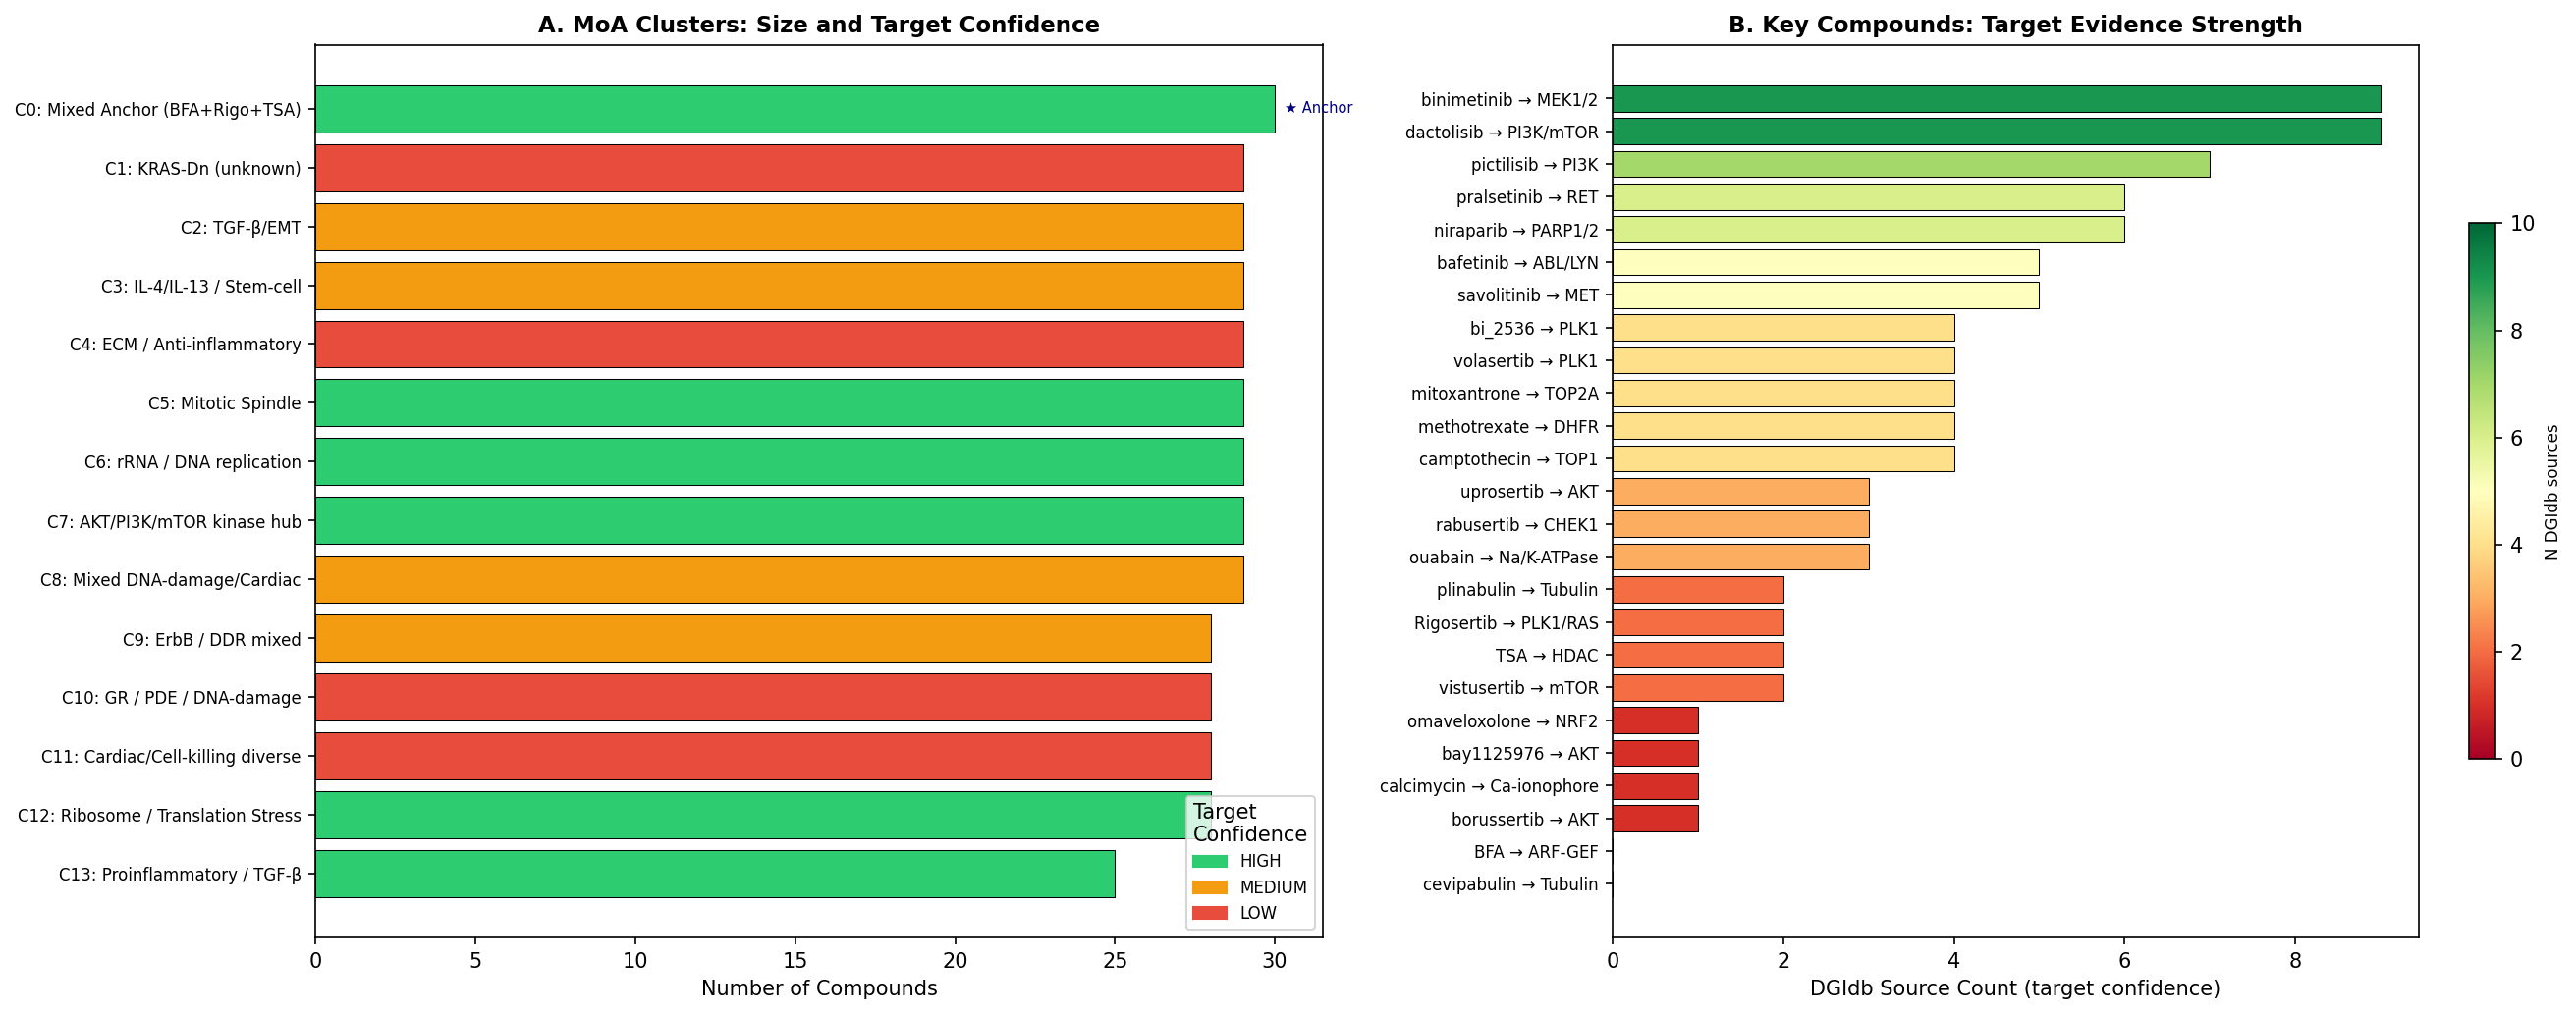
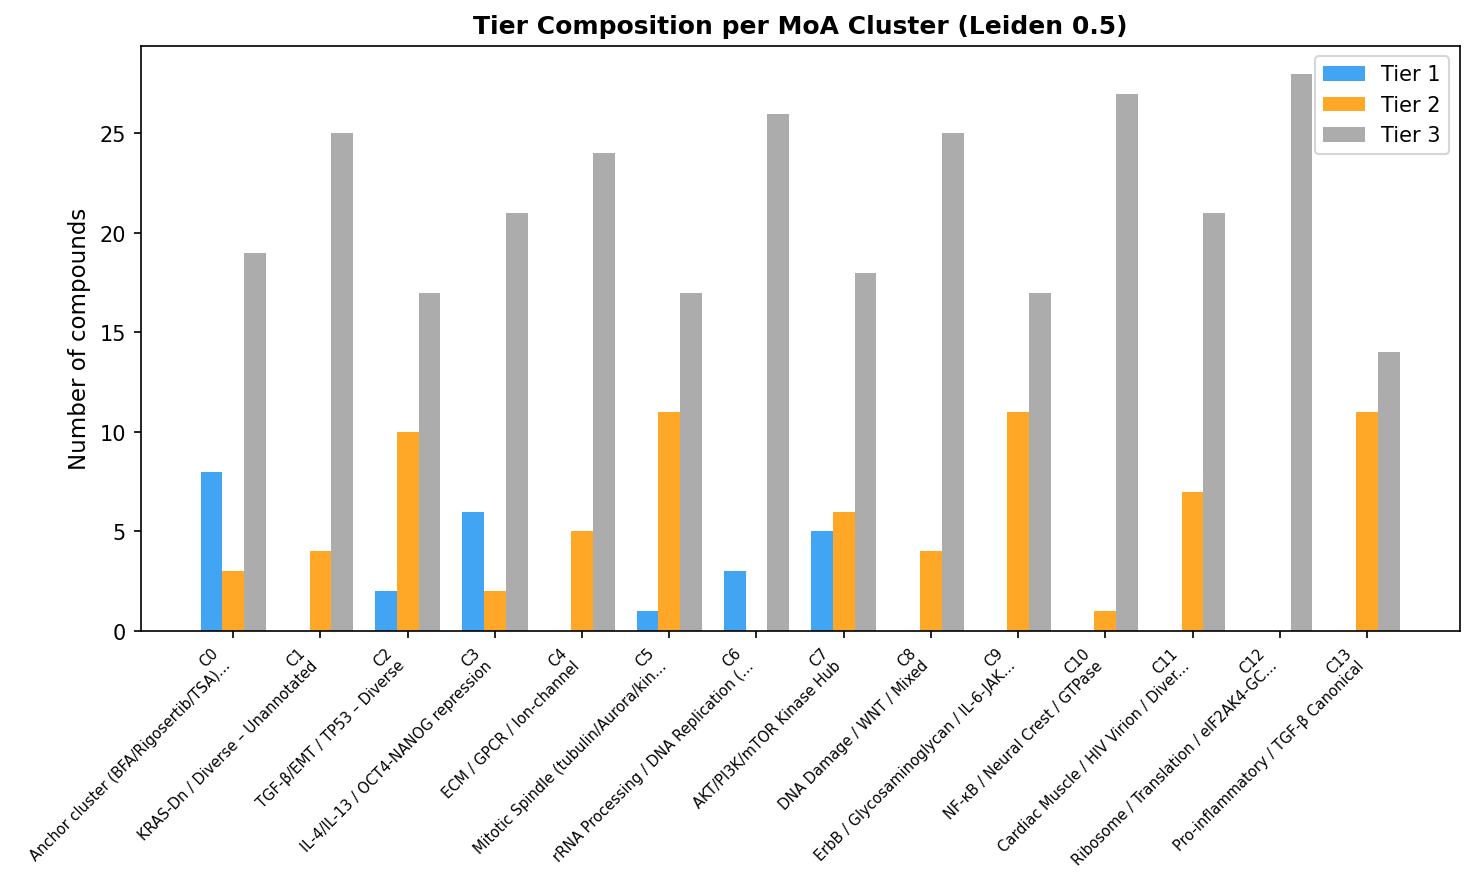
Compound-level clustering and NMF: independent recovery of MoA
The 399 compound-level signatures were embedded and clustered with Leiden, k-means, and hierarchical at multiple resolutions. Leiden was the most representation-stable (ARI 0.58–0.82 between dose-aggregated and dose-resolved inputs), and grouped all three evaluable positive controls in cluster 0 at every resolution.
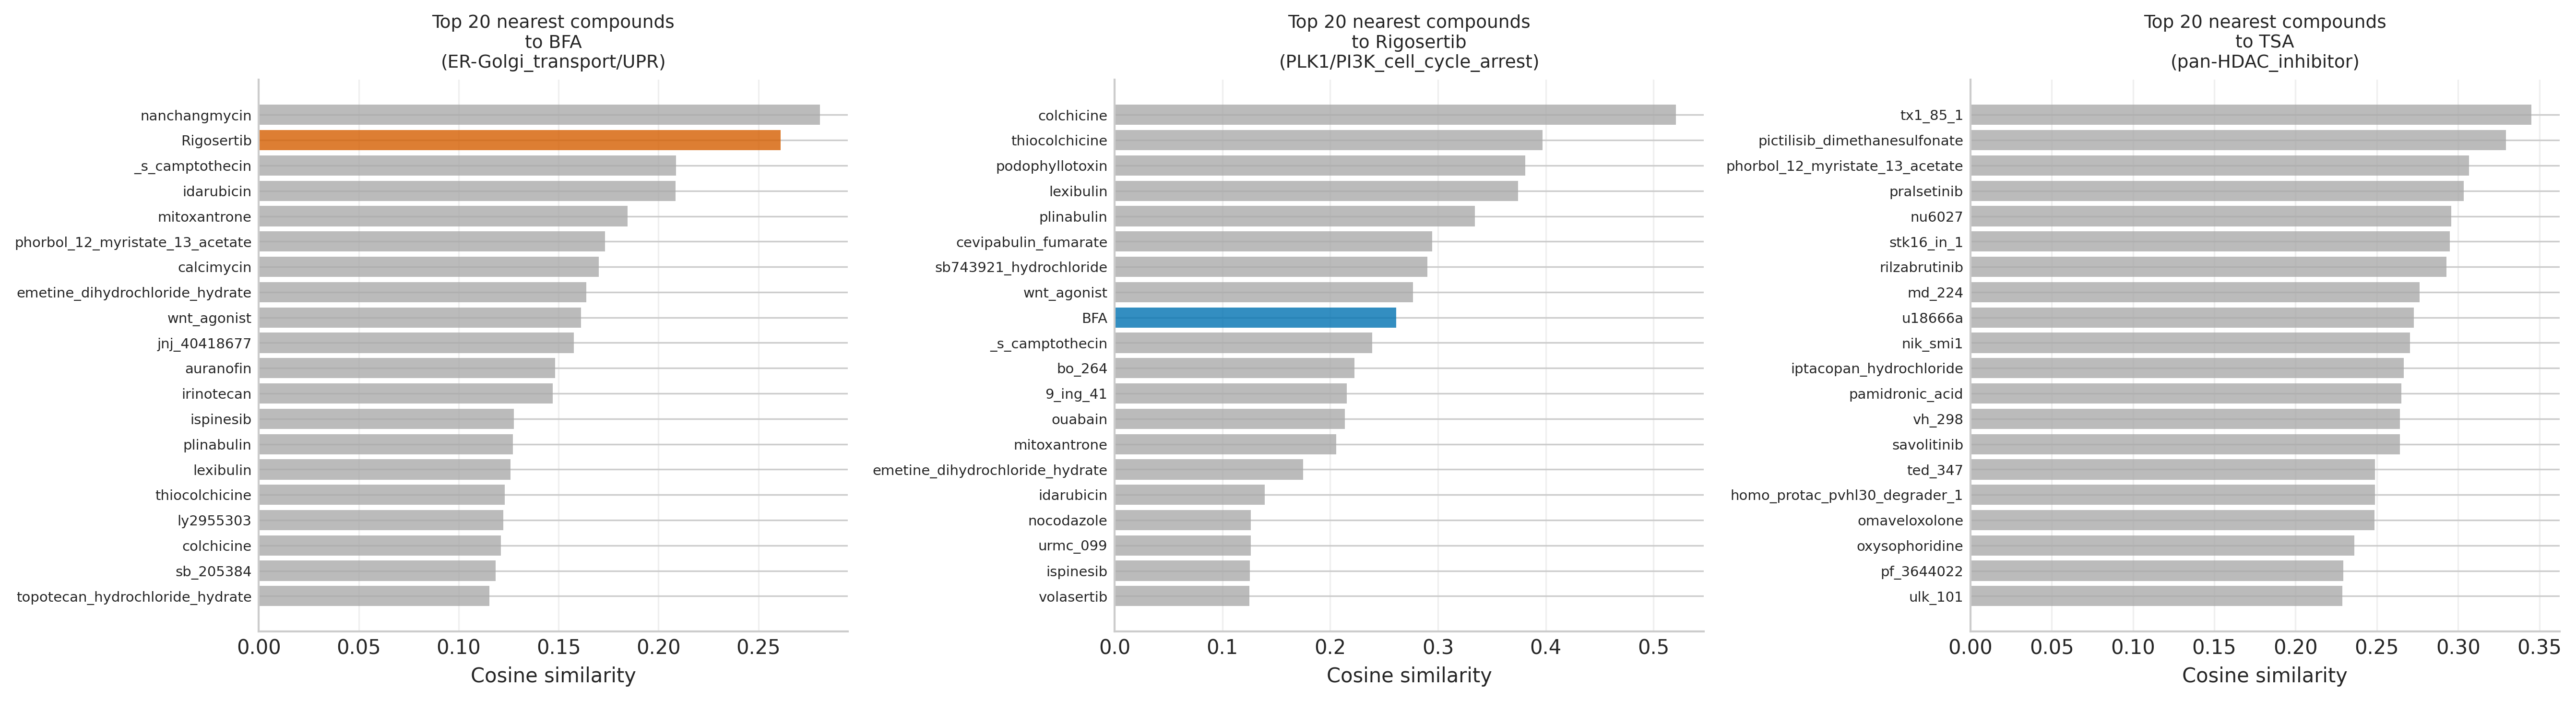
The translationally meaningful detail is in the neighbours. Rigosertib's top-5 nearest neighbours by cosine similarity are exclusively microtubule-destabilising agents (colchicine 0.521, thiocolchicine 0.397, podophyllotoxin 0.381, lexibulin 0.374, plinabulin 0.334). This is a textbook independent reproduction of the Jost et al. 2017 CRISPRi/a result that Rigosertib is a microtubule destabiliser, not (only) a PLK1 / RAS-mimetic — and it falls out of an unsupervised analysis with no tubulin prior.
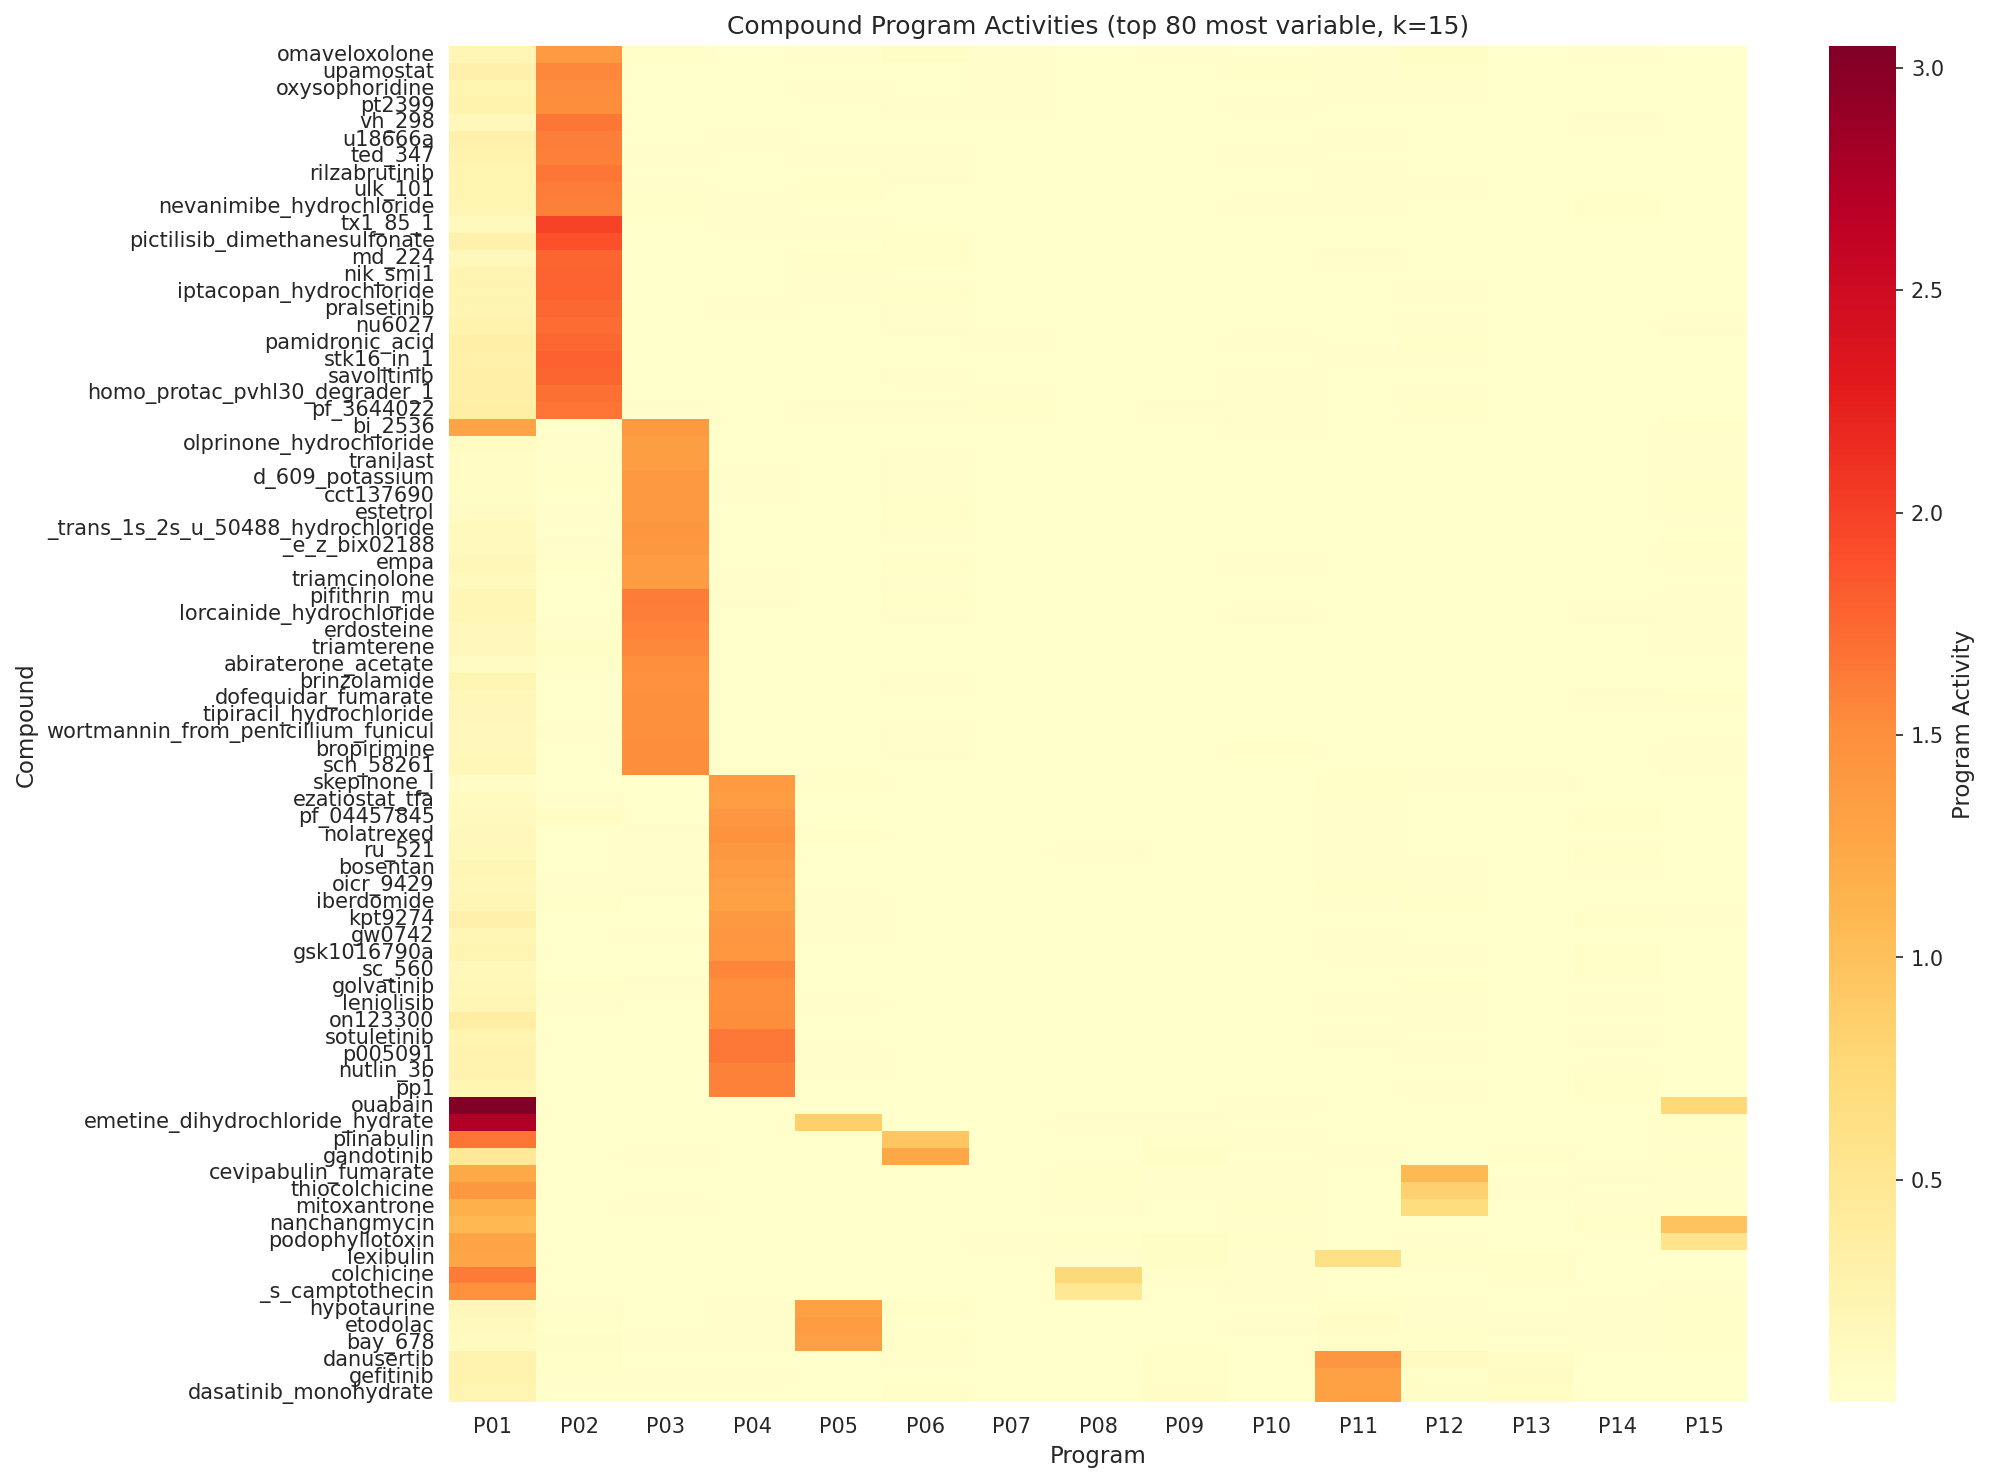
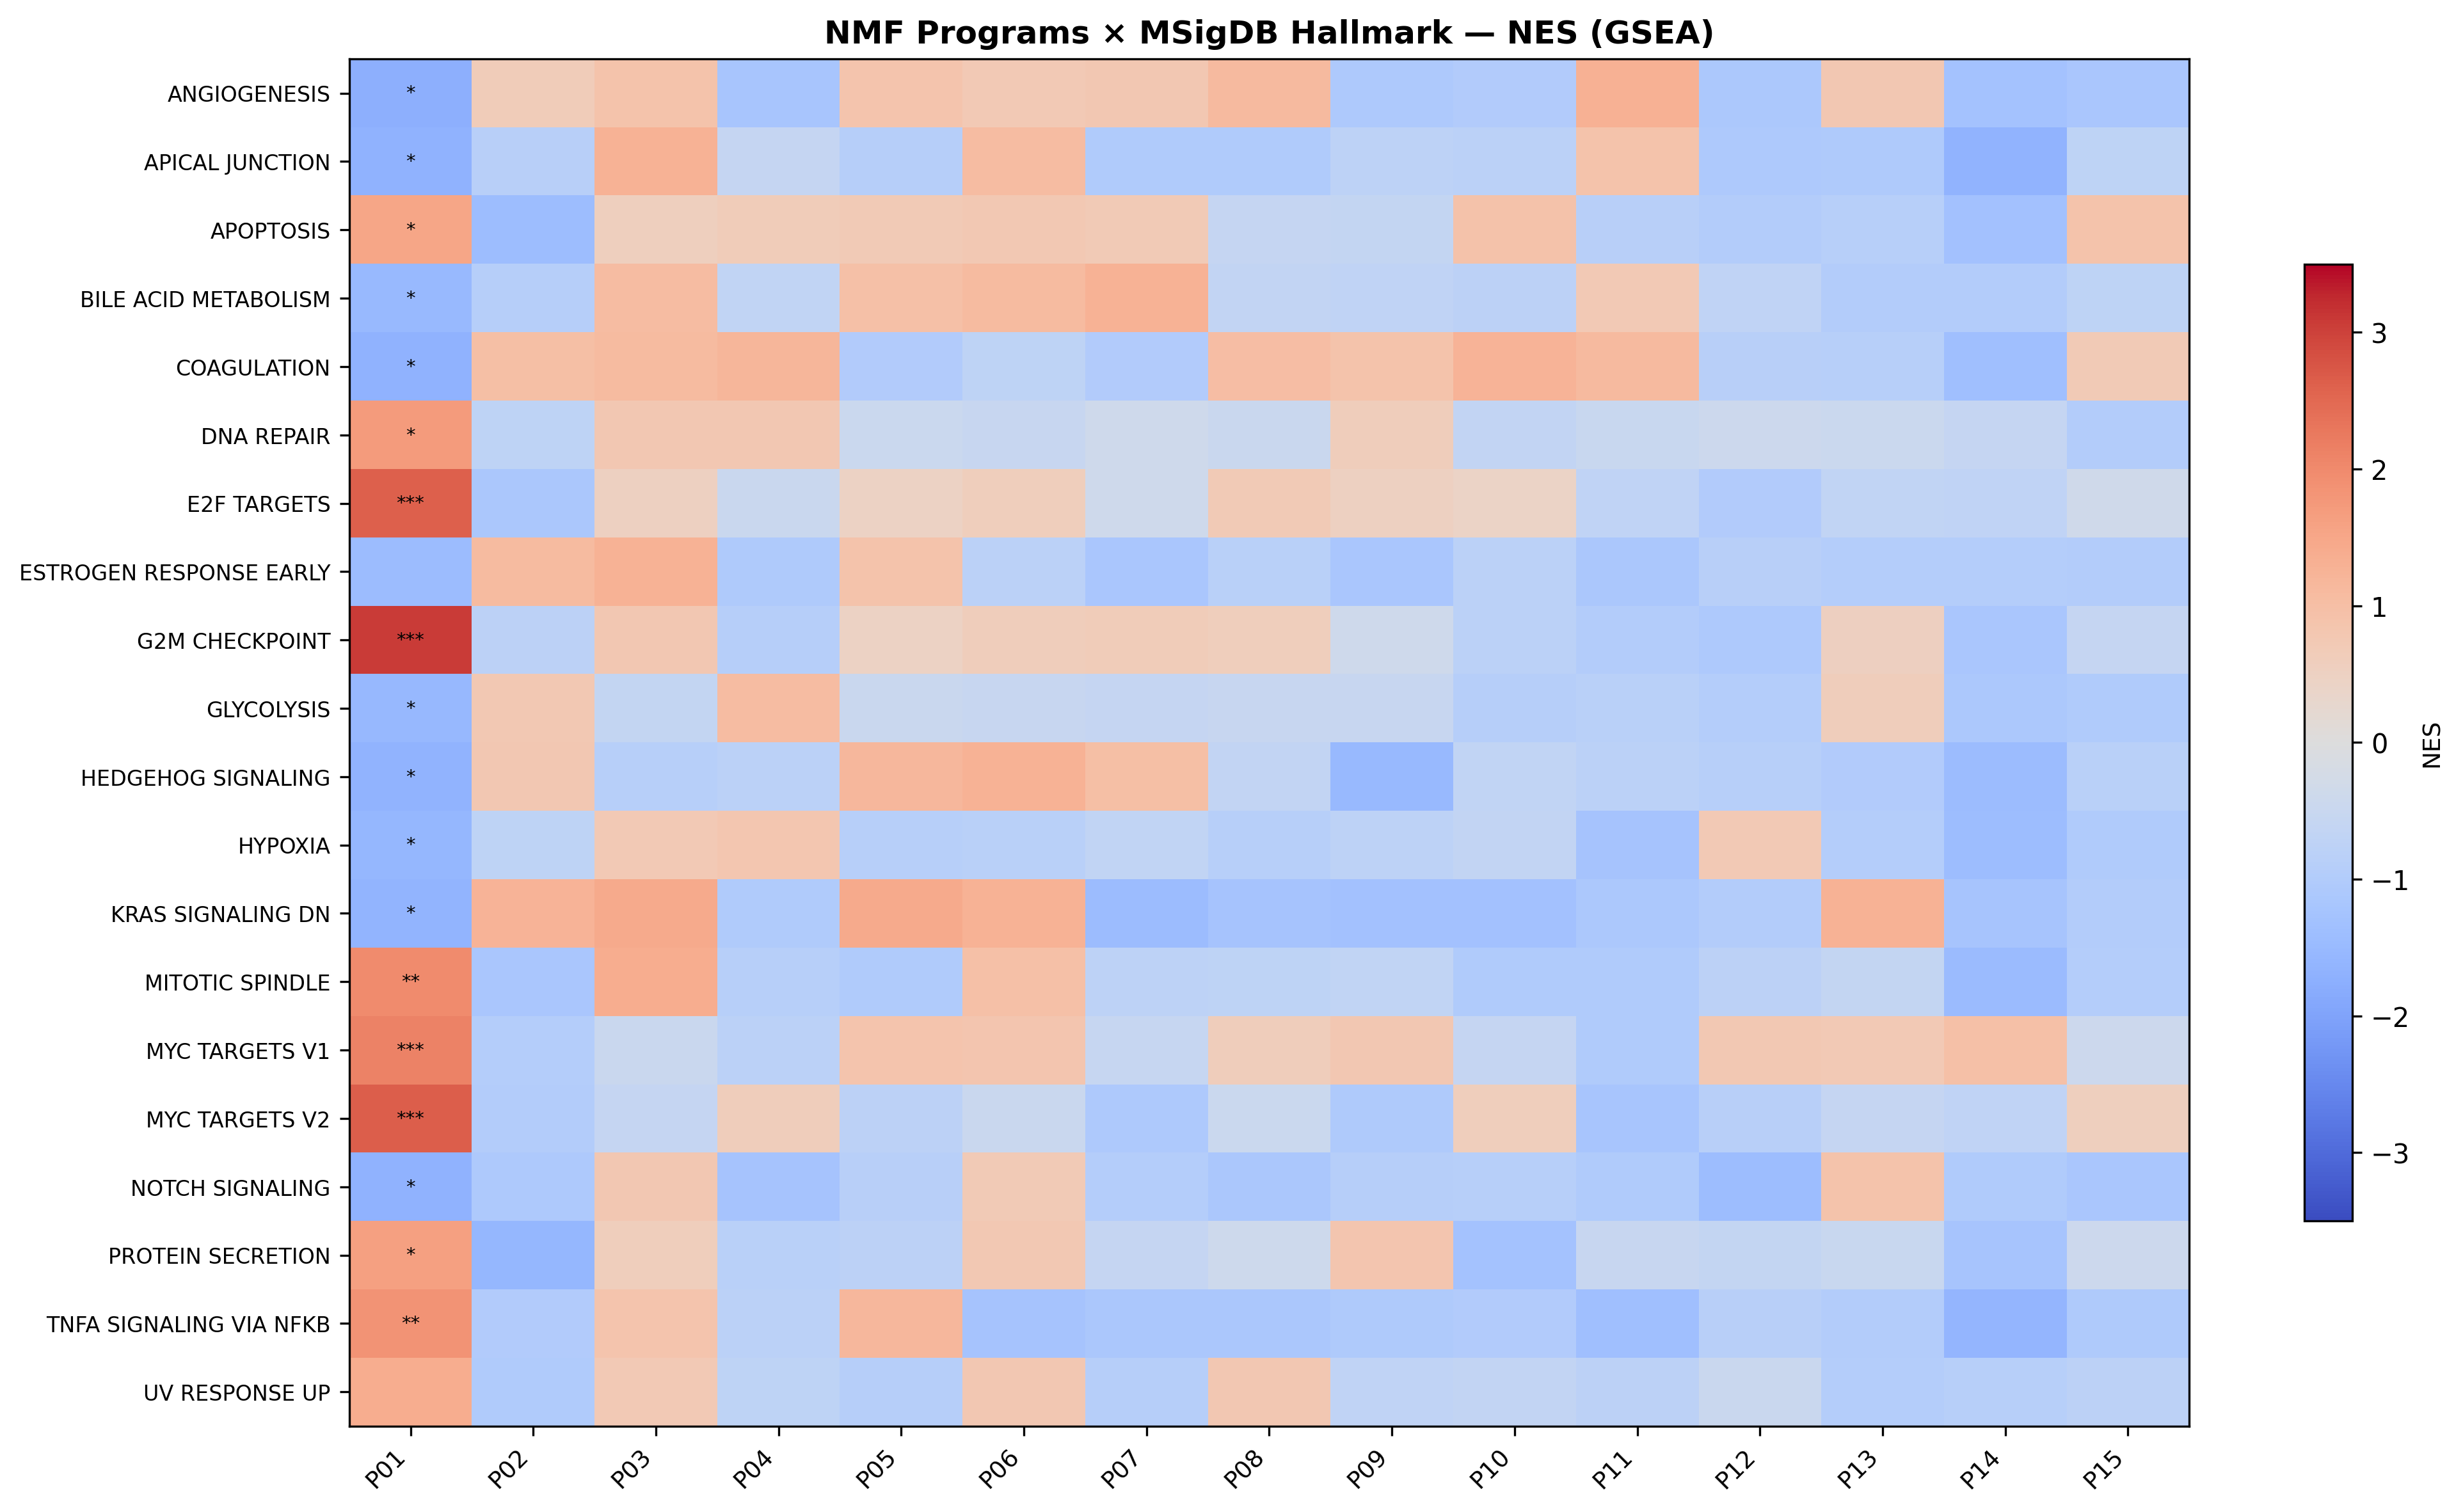
Independent NMF at rank-15 (cosine seed-stability 1.000, 65.3% variance explained) produced 15 reproducible programs. The biology re-emerged through a different lens:
- P01 (G2M / E2F / MYC, GSEA NES=3.08, FDR<0.001) — top compound activity from Rigosertib (1.074); BFA also lands here (4th highest).
- P02 (chromatin / TSA-specific) — top loadings include CCND1, CDKN1A, HDAC1.
- P11 + P14 (translation initiation / elongation) — capture ribosome biology with danusertib and ancitabine as top compounds.
The same biology arrives by Leiden clustering and by NMF program decomposition. That redundancy is what gives the next steps confidence to commit.
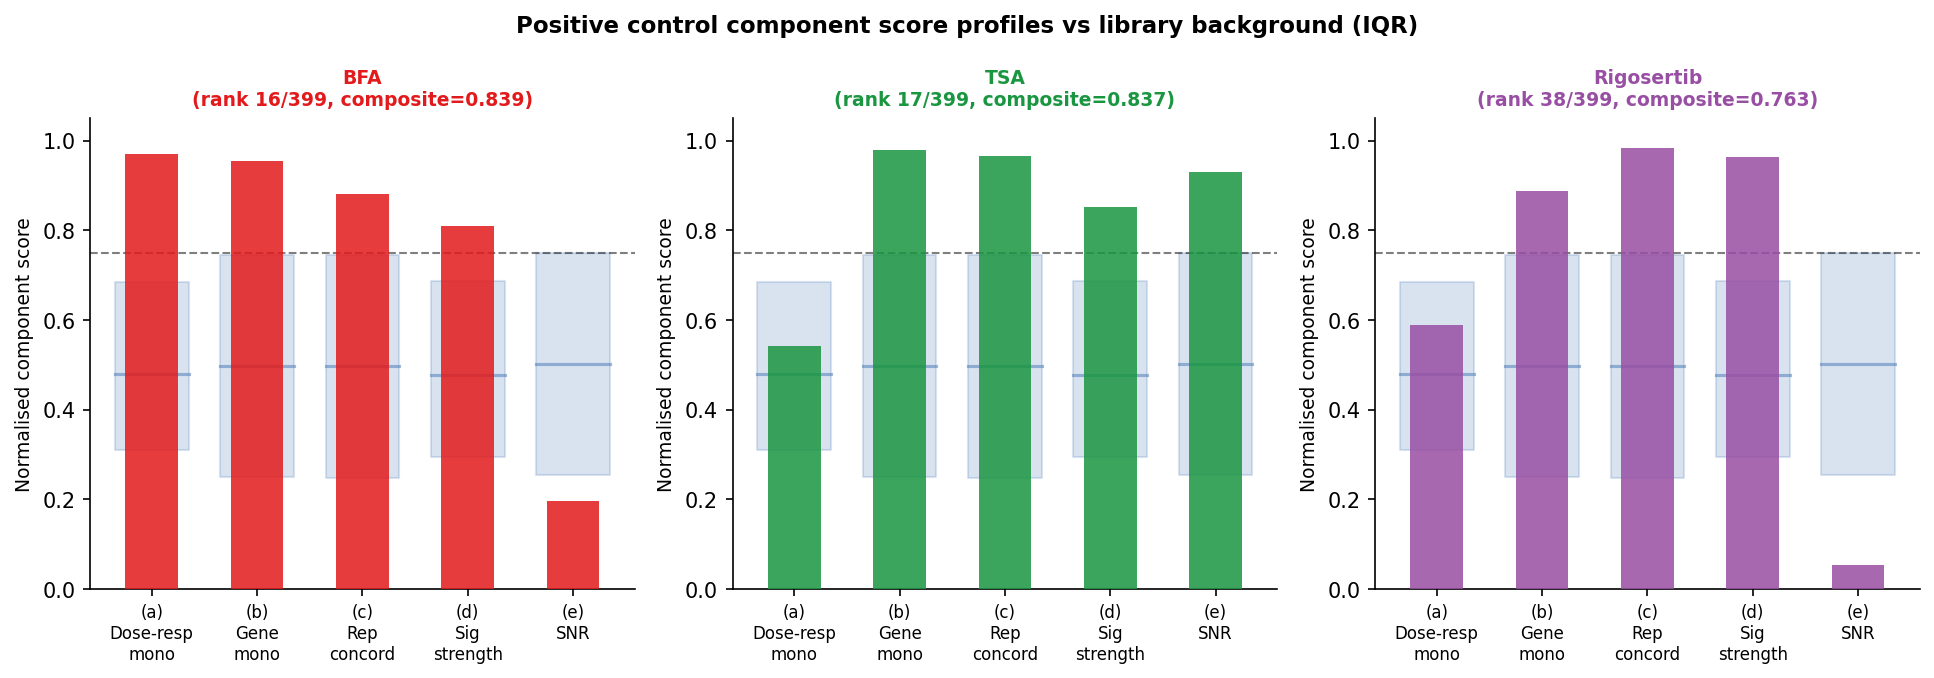
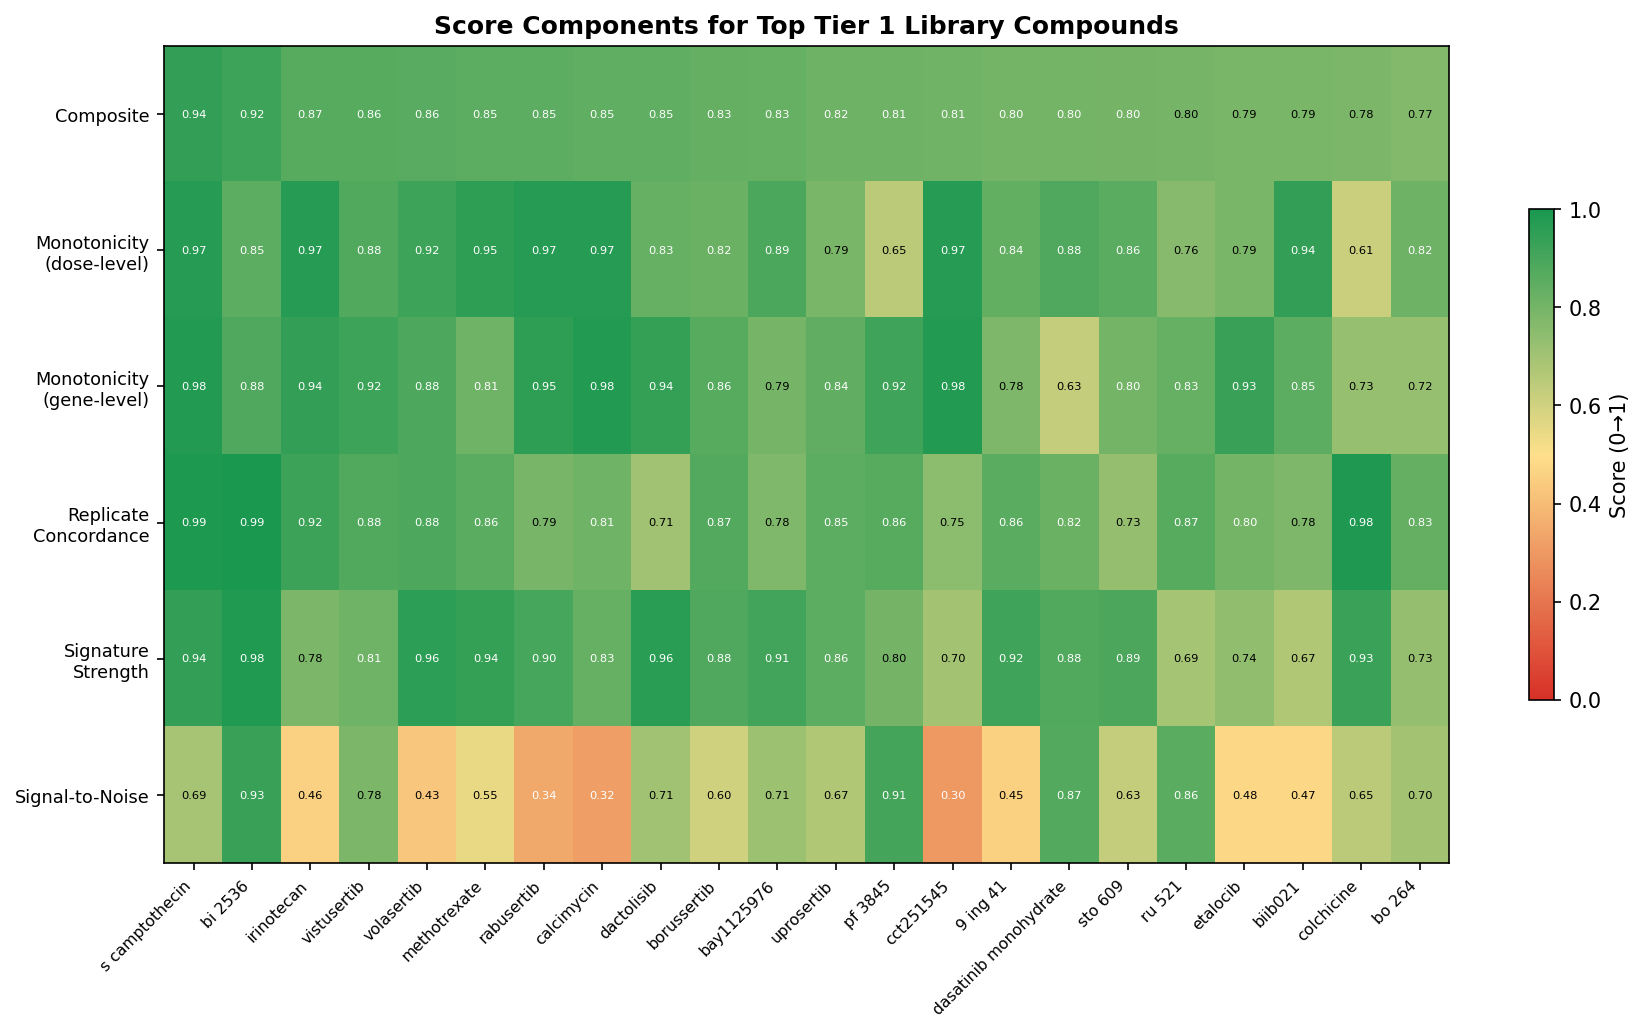
A defensible composite cleanliness score
The translational question is not "which compound is loudest?" — it is "which compound has a clean dose-response that a chemist can prosecute?" We built a 5-component cleanliness score:
| Component | Weight | What it captures |
|---|---|---|
| Dose-response monotonicity | 25% | Spearman r(log dose, mean |logFC|) |
| Gene-level monotonicity | 25% | Per-gene monotonic recruitment across doses |
| Replicate concordance | 20% | Within-dose Pearson between replicates |
| Signature strength at best dose | 20% | Number of FDR<0.05 genes; max |logFC| |
| SNR vs DMSO sham null | 10% | Bootstrap from 700 DMSO half-splits |
The DMSO sham null (50 random half-splits × 14 plates = 700 samples) was deliberately conservative on plates with few DMSO wells (Plate08 n=2, Plate12 n=3 inflate null variance). That motivated the down-weighted SNR contribution — monotonicity, not raw magnitude, drives the composite.
All three evaluable positive controls land in the top 9% of the library: BFA rank 16/399 (0.839), TSA rank 17/399 (0.837), Rigosertib rank 38/399 (0.763). The top library compound, ouabain (0.969), has Spearman r = 1.0 between log-dose and signature magnitude across all 6 doses.
Top-15 cleanest library compounds (positive controls excluded)
| # | Compound | Composite | Best dose (µM) | Sig. genes | Putative target |
|---|---|---|---|---|---|
| 1 | Ouabain | 0.969 | 10 | 5,347 | ATP1A1 (Na⁺/K⁺-ATPase) |
| 2 | Emetine | 0.956 | 10 | 5,275 | EIF4A / 40S ribosome |
| 3 | (S)-Camptothecin | 0.943 | 0.1 | 1,647 | TOP1 |
| 4 | BI-2536 | 0.922 | 10 | 1,112 | PLK1 |
| 5 | Mitoxantrone | 0.898 | 0.3 | 1,359 | TOP2A |
| 6 | PMA | 0.897 | 3 | 2,266 | PKC family |
| 7 | Nanchangmycin | 0.874 | 3 | 2,919 | Unknown |
| 8 | Irinotecan | 0.866 | 0.3 | 1,414 | TOP1 |
| 9 | Vistusertib | 0.864 | 1 | 564 | mTORC1/2 |
| 10 | Volasertib | 0.862 | 3 | 634 | PLK1 |
| 11 | Methotrexate | 0.855 | 10 | 820 | DHFR |
| 12 | Rabusertib | 0.853 | 0.3 | 131 | CHEK1 |
| 13 | Calcimycin | 0.848 | — | — | Ca²⁺ ionophore |
| 14 | Dactolisib | — | — | — | PI3K/mTOR |
| 15 | Borussertib | — | — | — | AKT |
The top of the cleanliness ranking is dominated by mechanistically potent agents — Na⁺/K⁺-ATPase, protein synthesis, TOP1/TOP2, PLK1, mTOR, PKC, DHFR, CHEK1.
Pathway enrichment & DGIdb target mapping
DGIdb queries recovered canonical targets for all evaluable positive controls: TSA → HDAC1–11 (DTC + GuideToPharmacology, 27 PMIDs), Rigosertib → PLK1/PIK3CA/KRAS-NRAS (TTD, TALC, CKB-CORE, CIViC). BFA's GBF1/Sec7-domain ARF-GEF target is absent from DGIdb — a known database gap, not a recovery failure.
Cluster-level enrichment is structurally weak: averaging 28–30 mechanistically diverse compounds cancels MoA-specific signal. Cluster 12 is the only cluster reaching FDR<0.05 at the consensus level — and it does so emphatically, with 10 GSEA terms FDR<0.001 spanning KEGG_RIBOSOME, REACTOME_RESPONSE_OF_EIF2AK4_GCN2_TO_AMINO_ACID_DEFICIENCY, and REACTOME_EUKARYOTIC_TRANSLATION_ELONGATION. The same biology is recovered independently by NMF programs P11 and P14. This triple convergence (cluster + two NMF programs) is the single strongest biological theme in the screen.
Of 53 target nominations across top-ranked compounds and cluster representatives:
- 60% had ≥2 independent DGIdb sources for direct biochemical interaction.
- 19% had a single direct source.
- 15% relied on pharmacological-class inference.
- 6% remained unknown (nanchangmycin, BO-264).
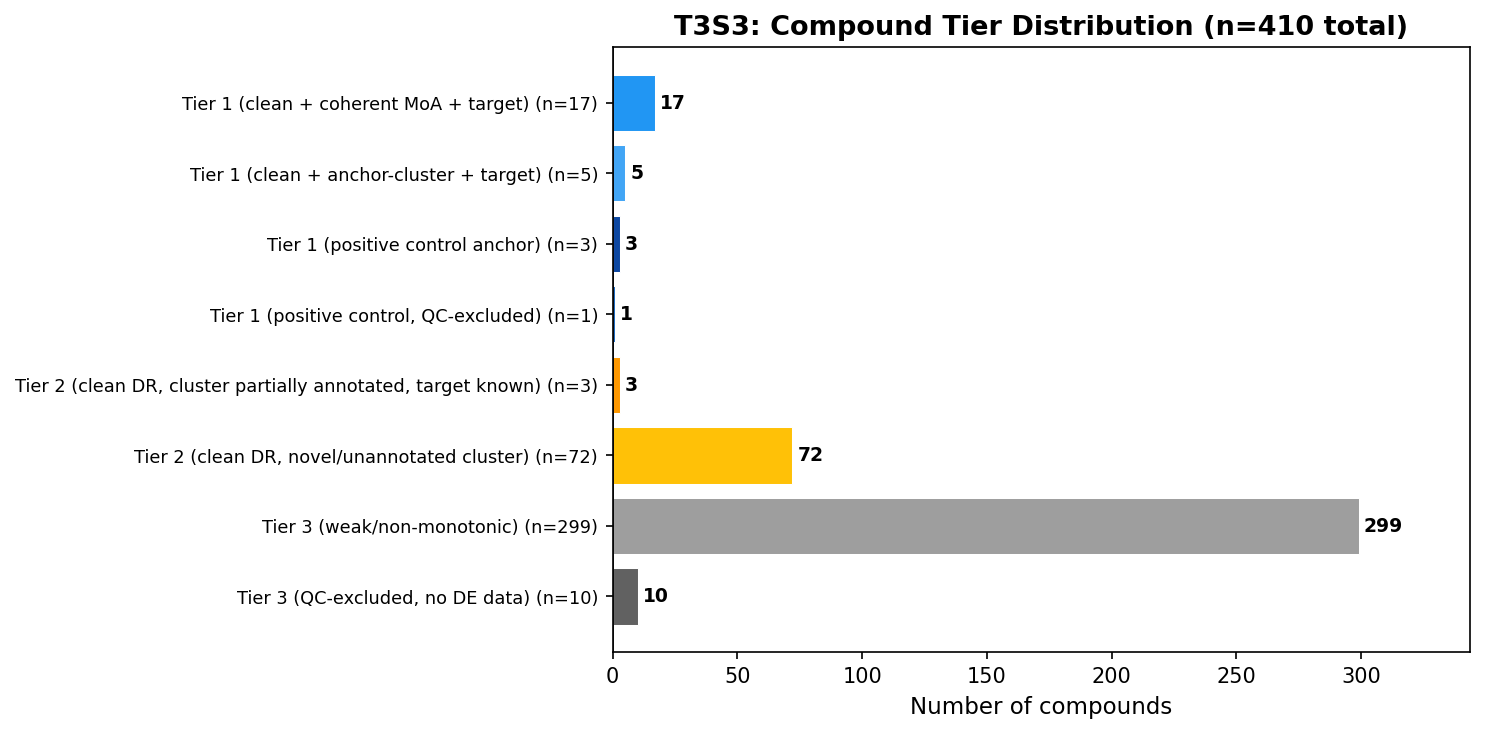
Tiering: 26 leads, 75 hypotheses, 309 deferred
The integration step applies a conjunctive policy:
- Tier 1 (n=26) — top-quartile cleanliness AND coherent cluster MoA AND target evidence (or positive-control anchor).
- Tier 2 (n=75) — top-quartile cleanliness, but cluster heterogeneity OR missing target annotation prevents triangulation.
- Tier 3 (n=309) — below-cleanliness or QC-excluded.
Tier 1 spans canonical oncology MoA backbones — TOP1 (camptothecin, irinotecan), PLK1 (BI-2536, volasertib), mTOR (vistusertib), DHFR (methotrexate), CHEK1 (rabusertib), PI3K/mTOR (dactolisib), AKT (borussertib), microtubule (multiple). All four positive controls placed in Tier 1, with Staurosporine flagged QC-excluded.
Top Tier-2 novel-MoA candidates
| Compound | Score | Cluster | Top NMF | Target / hypothesis | Why Tier 2 |
|---|---|---|---|---|---|
| Ouabain | 0.969 | 8 — DNA Damage / WNT / Mixed | P01 (G2M) | ATP1A1 confirmed (multi-source) | Cluster 8 heterogeneity |
| Emetine | 0.956 | 1 — KRAS-Dn / Diverse (unannotated) | P01 (G2M) | EIF4A / ribosome | Cluster unannotated |
| Mitoxantrone | 0.898 | 4 — ECM / GPCR / Ion-channel | P01 (G2M) | TOP2A | Cluster mixed |
| PMA | 0.897 | 8 — DNA Damage / WNT / Mixed | P15 (WNT-βcat) | PRKC family | Cluster heterogeneity |
| Nanchangmycin | 0.874 | 8 — DNA Damage / WNT / Mixed | P01 (G2M) | Unknown | Target unknown |
| Cevipabulin | 0.840 | 4 — ECM / GPCR / Ion-channel | P01 (G2M) | Tubulin (VDA class) | Cluster mixed |
| Omaveloxolone | 0.823 | 13 — Pro-inflammatory / TGF-β | P02 (chromatin) | NRF2 / NFE2L2 activator | Cluster unannotated |
| PF-477736 | 0.805 | 9 — ErbB / GAG / IL6-JAK-STAT | P06 (KRAS-Dn) | CHEK1 / WEE1 | Cluster heterogeneity |
| Capivasertib | 0.803 | 9 — ErbB / GAG / IL6-JAK-STAT | P06 (KRAS-Dn) | AKT1/2/3 | Cluster heterogeneity |
| GSK2334470 | 0.801 | 9 — ErbB / GAG / IL6-JAK-STAT | P06 (KRAS-Dn) | PDK1 | Cluster heterogeneity |
| Plinabulin | 0.798 | 9 — ErbB / GAG / IL6-JAK-STAT | P01 (G2M) | Tubulin | Cluster heterogeneity |
| Mocetinostat | 0.793 | 9 — ErbB / GAG / IL6-JAK-STAT | P06 (KRAS-Dn) | HDAC | Cluster heterogeneity |
| Bimiralisib | 0.765 | 9 — ErbB / GAG / IL6-JAK-STAT | P06 (KRAS-Dn) | PI3K | Cluster heterogeneity |
Tier 2 is the highest-confidence pool of novel-MoA hypotheses where cluster heterogeneity (not biology) blocked Tier 1 placement. These are the rows a translational lead should circle.
Translational hypotheses generated by this analysis
This is the section a discovery lead actually cares about. The pipeline produced named, falsifiable hypotheses that map directly onto downstream decision points — orthogonal validation, target deconvolution, indication selection, and screen redesign.
- Rigosertib's microtubule activity is the dominant transcriptional driver in HEK293. Rigosertib's nearest neighbours are exclusively tubulin destabilisers. This is independent transcriptomic confirmation of the Jost 2017 CRISPR result and argues that biomarker strategies for Rigosertib (currently MDS/AML) should incorporate tubulin-binder co-response signatures rather than relying solely on PLK1/RAS readouts.
- Ouabain has a translatable signature beyond cardiac-glycoside cytotoxicity. Highest cleanliness score in the entire library (0.969), confirmed ATP1A1 target, but cluster 8 is mixed. The combination of clean dose-response with strong G2M program activity suggests ATP1A1 modulation re-purposable for cell-cycle-driven indications is worth following up — particularly given recent literature on Na⁺/K⁺-ATPase as an oncology target. Compound-level (not cluster-level) MoA scoring would have moved this to Tier 1.
- Cluster 12 antimetabolites converge on GCN2/eIF2AK4 amino-acid- deficiency response. Triple-convergent biology (cluster + P11 + P14): methotrexate, 5-azacytidine, amsacrine, ancitabine. The integrated stress response via GCN2 is a known but under-prosecuted oncology axis; this screen identifies which library scaffolds engage it most cleanly. Therapeutic implication: combination with GCN2 modulators or amino-acid-restriction strategies in tumour types with elevated translation flux.
- Cluster 9 is an actionable AKT/PI3K/mTOR pharmacology hub. Capivasertib, GSK2334470, bimiralisib, mocetinostat and 11+ other clinical-stage kinase inhibitors co-cluster with coherent KRAS-Dn (P06) program activity. For a translational team, this is a ready-made co-response panel for AKT/PI3K- pathway combination scouting — the cluster effectively behaves as a computational synthetic-lethal screen of pathway redundancy.
- Omaveloxolone's NRF2 signature is recoverable from a 2-replicate well. Cleanly placed in cluster 13 (pro-inflammatory / TGF-β) with P02 chromatin-program loading. NRF2 activators are a hard-to-screen MoA because the readout is often pathway-restricted; DRUG-seq-style transcriptional screening looks like a viable surrogate for NRF2 functional confirmation in a high- throughput format.
What this analysis tells you about screen design
Two structural lessons that biopharma teams running their own DRUG-seq programs should internalise:
- Compound-plate confounding is a feature when exploited correctly. Per-plate cell-means voom with EB shrinkage gives you stable variance from n=2 replicates that no pooled-plate model can match. Fix one compound per plate; don't randomise across plates.
- Monotonicity-weighted cleanliness penalises cytostatic MoAs. Cluster 12 — the most enrichment-significant theme in the entire screen — has zero Tier 1/2 members because antimetabolite trajectories plateau. Run a parallel cytostatic scoring track (e.g. signature divergence onset + plateau strength) to surface this MoA class.
And one limitation that should be stated plainly: HEK293 is not a disease-relevant cell line. Every biological inference here is a transcriptional MoA hypothesis, not an indication claim. The natural next step is to replay the Tier 1 / top Tier 2 set in two or three disease-relevant lines (e.g. cancer panels for the cell-cycle/topoisomerase compounds; iPSC-derived cardiomyocytes for ouabain) and ask whether the cleanliness ranking transfers.
The pipeline reconstructed canonical MoA biology for three of four positive controls through five independent computational routes — DE volcanoes, Leiden cluster co-assignment, NMF program loadings, GSEA enrichment, and DGIdb target lookup. That redundancy is what licenses the downstream tiering: when a Tier 1 call is made, it rests on five concordant pieces of evidence, not one. When a Tier 2 hypothesis is proposed (ouabain, emetine, omaveloxolone), the gap to Tier 1 is named — cluster heterogeneity, missing target annotation, plateau response — and therefore actionable.
For biopharma translational teams, the value of a DRUG-seq screen is not the count of significant genes per compound. It is the size and quality of the falsifiable hypothesis pool the screen generates. This analysis produced 26 high-confidence leads, 75 named hypotheses, and a clearly-flagged structural blind spot — the right shape of output for a translational portfolio decision.
Acknowledgements. This re-analysis builds on the publicly released Ginkgo Datapoints GDPx4 DRUG-seq dataset. The original screen is the foundation; everything here is a downstream re-read.
Interested in this kind of analysis?
See how Inflexa runs end-to-end DRUG-seq pipelines from raw counts to tiered, target-annotated hypothesis tables.