When the Headline Isn't the Whole Paper: Re-Mining an NHP Obesity / T2D Atlas
A translational re-analysis of the Amgen cynomolgus transcriptomic + proteomic atlas (Zhang et al., Cell Reports 2023)
Zhang X, Hu LG, Lei Y, Stolina M, Homann O, Wang S, Véniant MM, Hsu Y-H. A transcriptomic and proteomic atlas of obesity and type 2 diabetes in cynomolgus monkeys. Cell Reports 42(8):112952, 29 August 2023 (PMID 37556324). Data: GEO GSE188418 (RNA-seq) + companion proteomics tables.
Zhang et al. published a 27-tissue RNA-seq + DIA-MS proteomics resource across cynomolgus macaques with spontaneous obesity or T2D, nominating SLC2A1 / PCSK1 (obesity) and SLC30A8 / SLC2A2 (T2D) as targets. We re-analysed the same data under a strict constraint — those four targets, and the immune-up / metabolism-down headline, were off the table — to ask whether the dataset still has translationally actionable signal underneath. It does. Below: 19 novel both-modality candidates clustering on three druggable axes (V-ATPase / lysosome, nuclear pore, ubiquitin-proteasome), an adipose→liver crosstalk panel led by GDF15→RET and LEP→LEPR, and an RNA–protein discordance signature concentrated in the obese left ventricle and consistent with translational/proteostatic buffering. We also pin down what the data cannot tell you, because that's where most re-analyses of this dataset will go wrong.
Why re-mine this dataset
Zhang et al. delivered the largest paired bulk RNA-seq + DIA proteomics atlas of spontaneous metabolic disease in non-human primates — 22 animals, up to 27 tissues per animal, two etiologically distinct cohorts (obesity, T2D). The published headline did three things well: (i) called per-tissue DEGs and DEPs, (ii) framed the field-level pattern (adipose-dominated obesity, multi-organ T2D, immune-up / mitochondria-down), and (iii) nominated four targets backed by GLUT/zinc-transporter biology already familiar to the diabetes field. What it did not do: model RNA–protein discordance as biology, map inter-tissue secreted-factor crosstalk, separate obesity-only from T2D-only from shared signal in a factorial frame, or test for sex effects. Those are the high-value questions for a translational team — and they're the questions an NHP atlas is uniquely positioned to answer. So we ran them.
What the cohort actually supports — and what it doesn't
The most consequential finding of this re-analysis is structural. The two arms of GSE188418 are non-overlapping experiments. No animal is in both. That has three immediate consequences for any joint modelling:
- The obesity × T2D interaction term is not estimable. Every "shared" call in this work — and in the original paper — is a post-hoc intersection of two independent within-cohort contrasts, not a tested interaction. We label them as such.
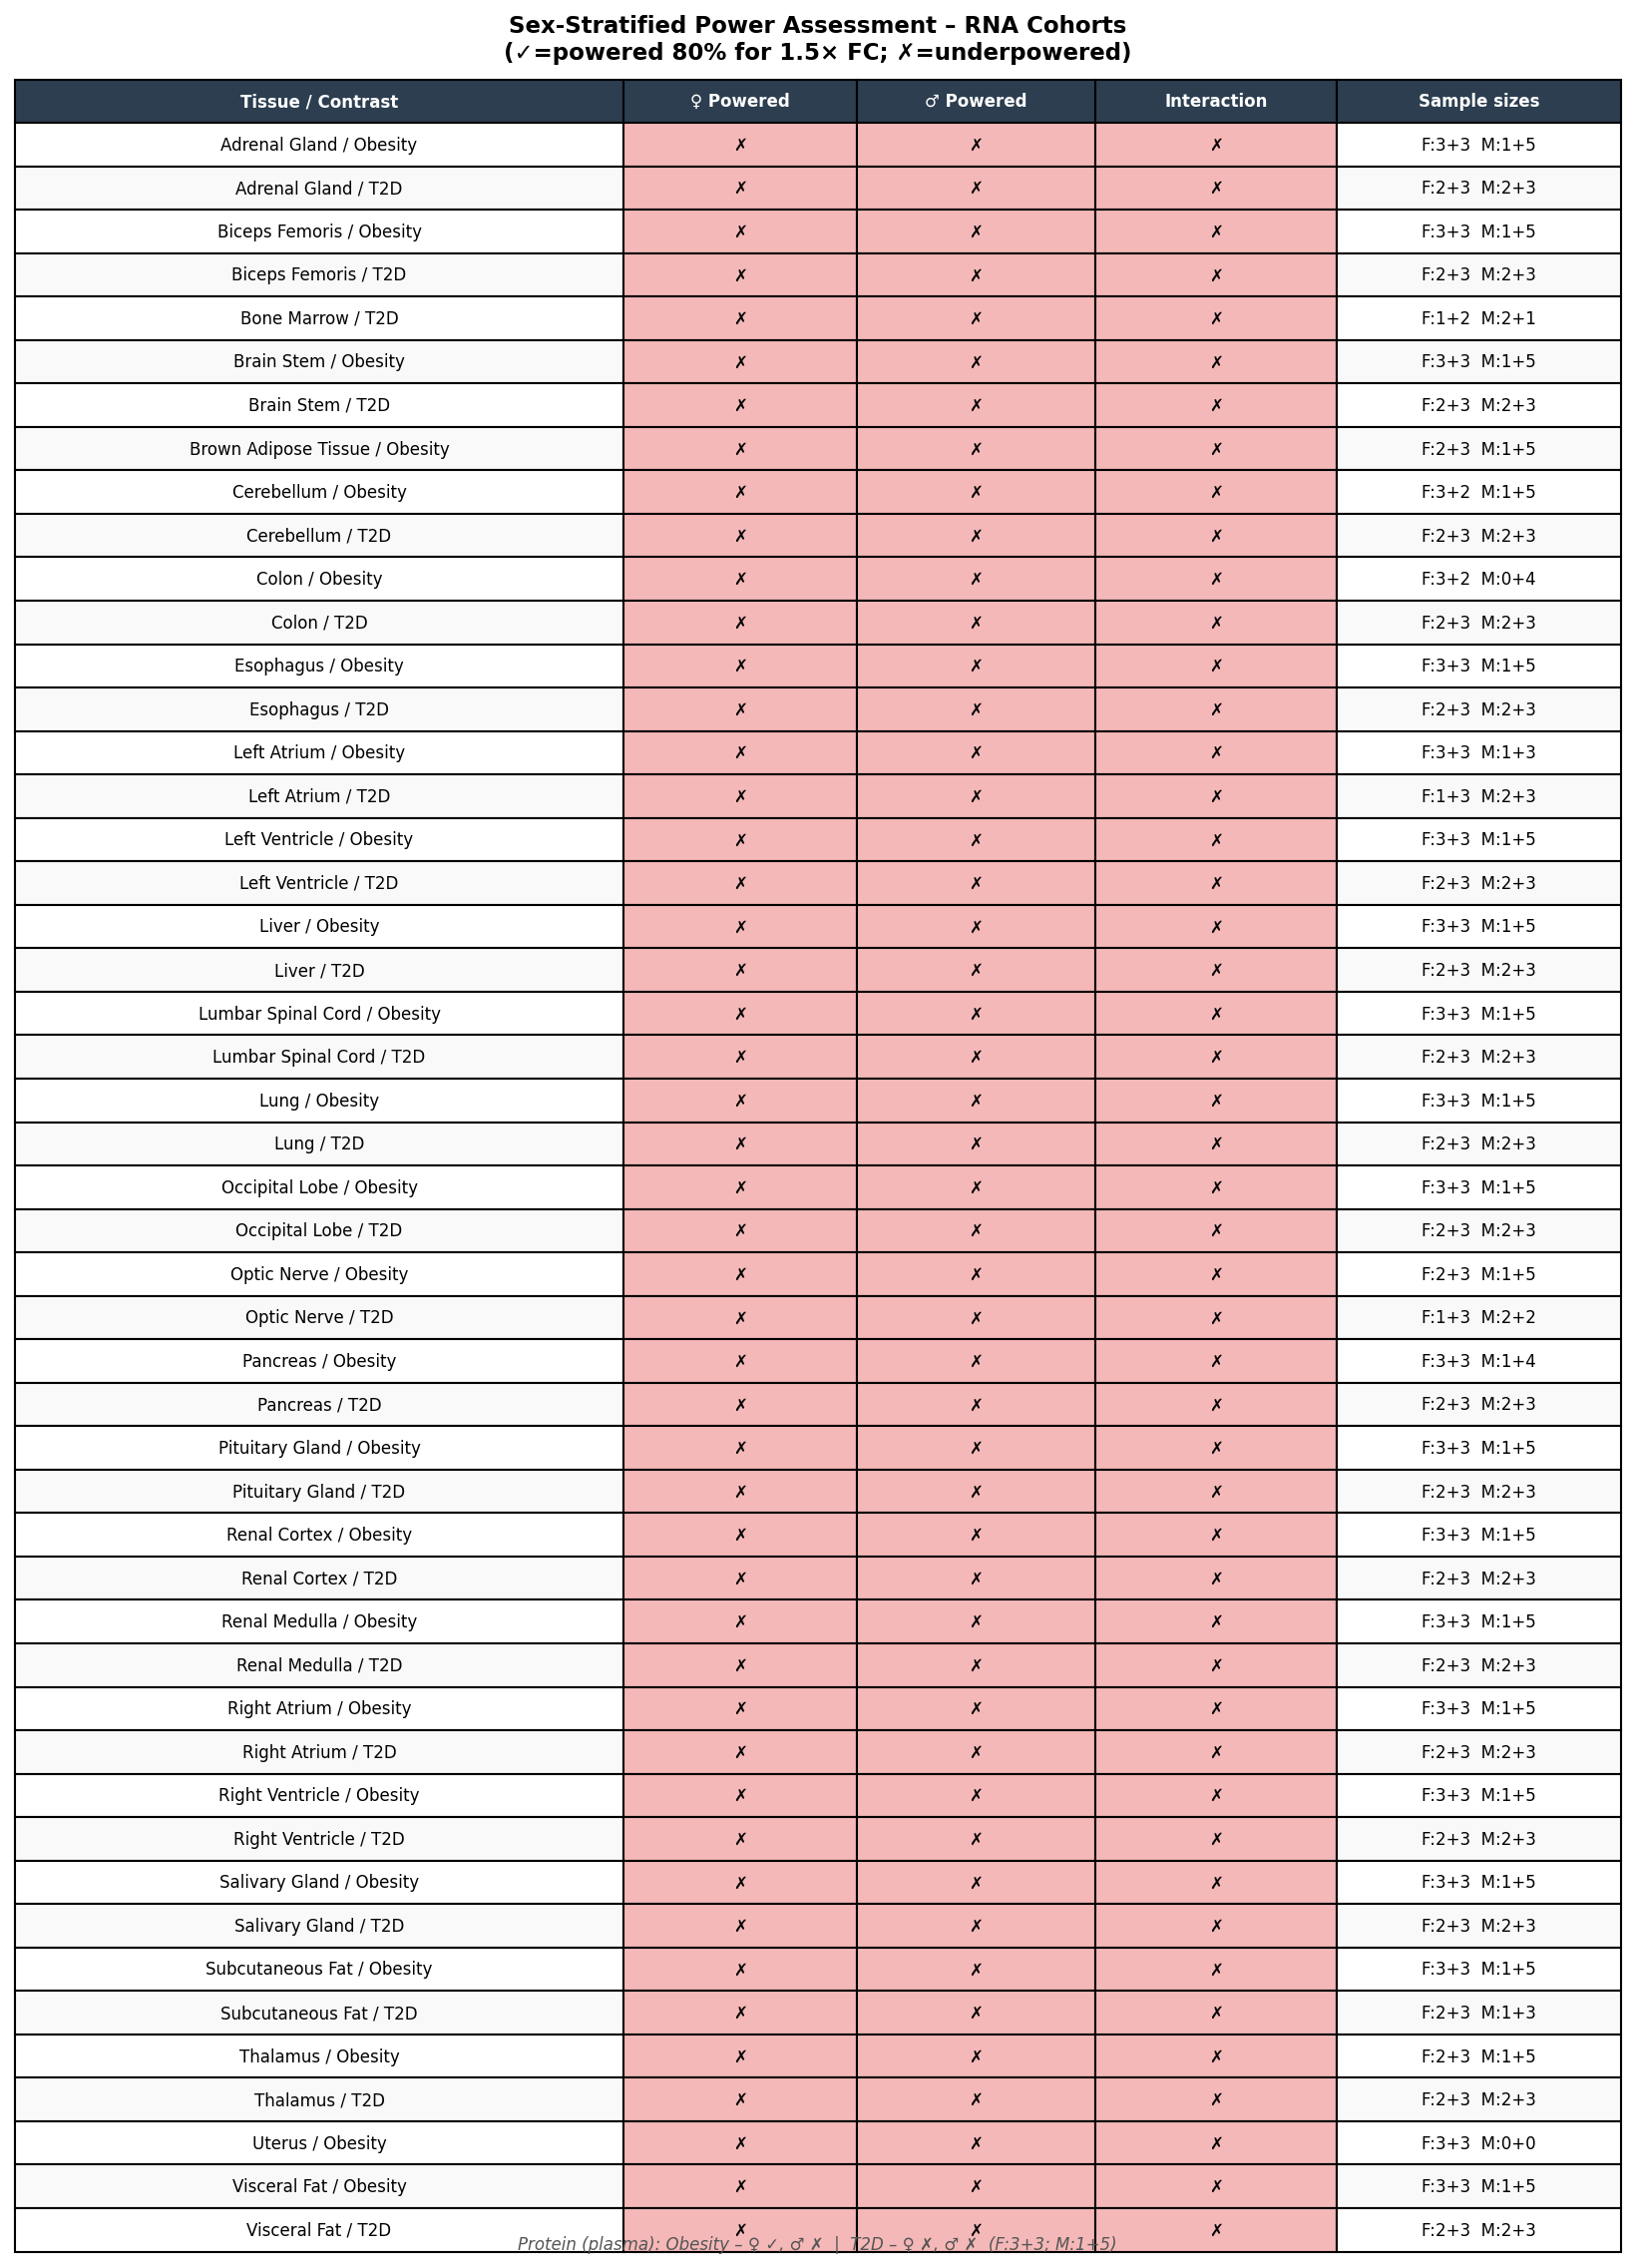
- Sex-stratified RNA differential expression is infeasible across all 26 tissues. The Non-Obesity reference cohort has a single male (OW2); the T2D cohort has 4 controls (2F, 2M). Of 51 modality × tissue × experiment × sex cells assessed at a deliberately permissive threshold (RNA n≥4, protein n≥3), only 1 cell passed — Plasma / Obesity / Female (3 vs 3) — and it returned no FDR<0.1 hits.
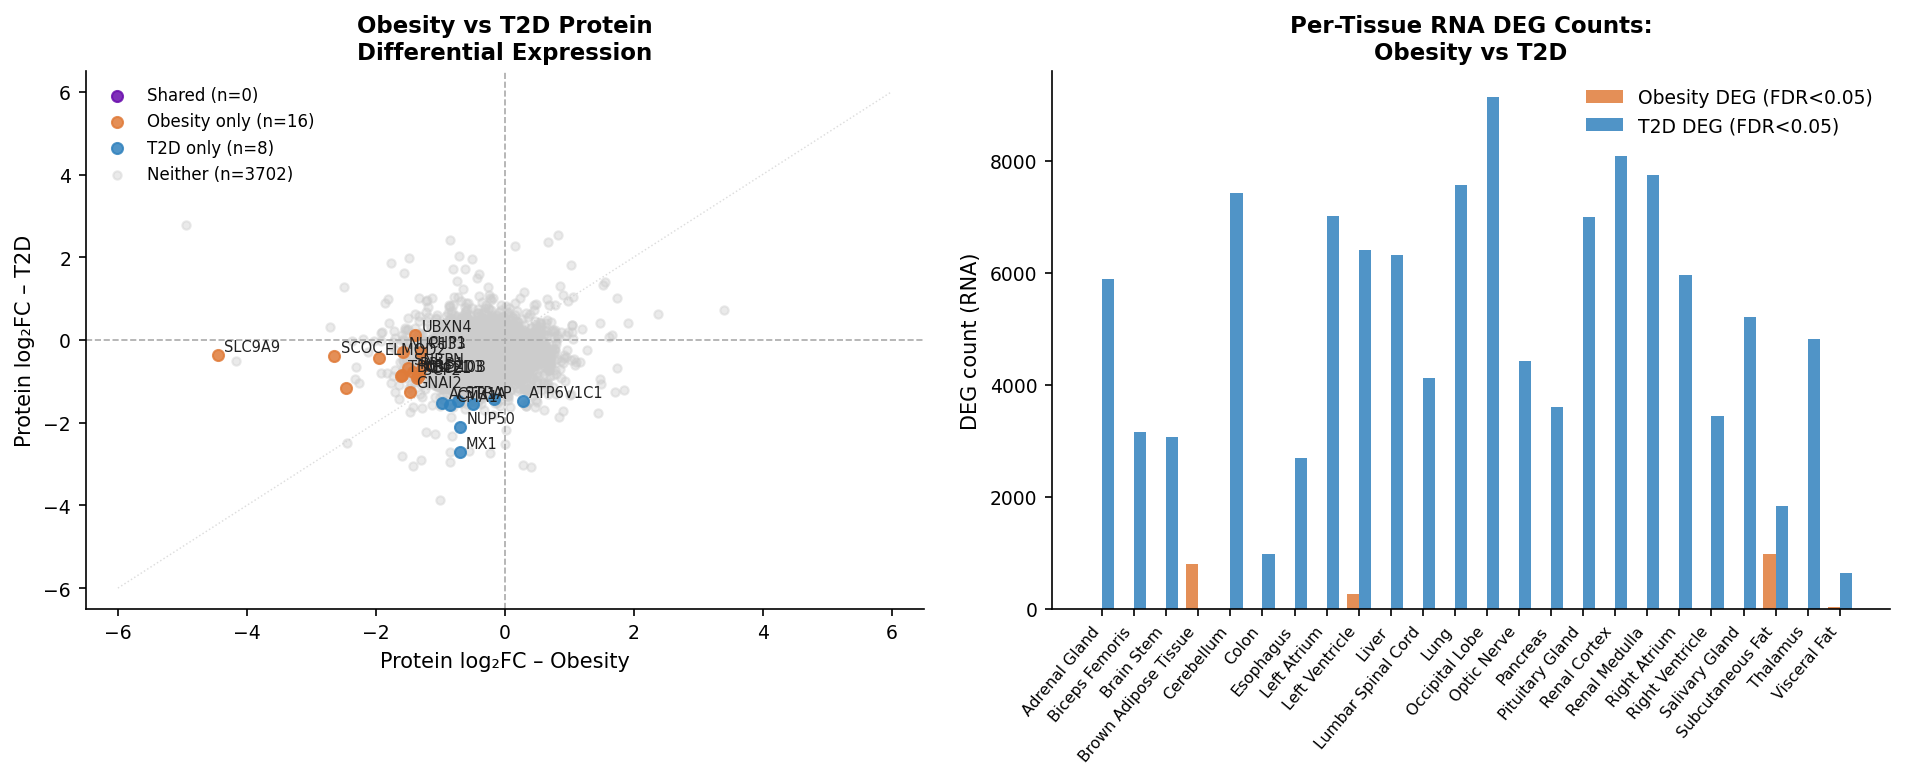
- The obesity transcriptional signal collapses in 20 of 26 tissues — zero FDR<0.05 genes — which is overwhelmingly a consequence of Non-Obesity-arm underpowering rather than a biological null. Detectable obesity RNA signal concentrates in subcutaneous fat (969 genes), brown adipose (795), left ventricle (271), visceral fat (26), pancreas (3), left atrium (1). T2D, by contrast, drives broad reprogramming (up to 9,140 FDR<0.05 genes in occipital lobe).
We mention this first because every downstream finding has to be read through it. The pattern below is real biology modulated by a power asymmetry.
We propagated this asymmetry into FDR thresholds (RNA FDR<0.05; protein FDR<0.1, justified by per-tissue n=4–8 and cross-tissue Stouffer meta across up to 21 tissues), into a power table that gates every sex-stratified call, and into per-gene flags on the final shortlist (OBESITY-RNA-UNDERPOWERED, LOW-PROT-TISSUE-COVERAGE).
RNA–protein discordance as biological signal, not noise
The published paper noted modest RNA–protein correlation as a caveat. We treated it as a phenotype.
Across 91,563 gene × tissue × disease pairs, 23.4% are RNA-only discordant (RNA significant, protein not). For the T2D contrast, this set is significantly enriched for:
- Ubiquitin-proteasome regulators — GOBP regulation of proteasomal Ub-dependent catabolism, n=44 overlap, OR=8.15, BH FDR=0.022.
- Single-stranded RNA binding proteins — AGO2, FMR1, PABPC1, YBX1; OR→∞.
- Translational elongation — OR=2.67.
- ER-stress translational control — DDX3X, EIF2S1, EIF4G1.
This converges with the GSEA-level T2D pattern: coordinated suppression of Hallmark Myc Targets V1 (NES=−2.74), mTORC1 (NES=−1.90), E2F Targets (NES=−2.12), G2-M Checkpoint (NES=−1.84), and KEGG RNA Transport (NES=−2.19), alongside upregulation of Notch (NES=+2.17), Myogenesis (NES=+2.17), and Wnt/β-catenin (NES=+1.78).
The mechanistic interpretation — and it is a hypothesis, not a conclusion — is that a substantial fraction of the T2D mRNA-up signal is being buffered at the protein level by coordinated UPS-mediated turnover and translation-control suppression. That this triangulates with the cross-tissue protein meta (which finds 37/37 disease-significant proteins moving down) makes the buffering hypothesis the parsimonious read.
A second, independent discordance pattern: all 59 obesity-discordant gene–tissue pairs localise exclusively to the left ventricle — including UBXN4 (|Δ logFC|=4.19), NDUFA5, ATP6V1C1, SNX2, DDAH2. The obese cynomolgus left ventricle is doing something proteostatically that its transcriptome is not announcing. UBXN4 (p97/VCP cofactor) and ATP6V1C1 (V-ATPase) both make the final 19-gene shortlist via independent criteria.
Caveat we are explicit about: RNA and protein come from independent within-animal cohorts and per-tissue protein power is low, so the rna_only class is partly inflated by methodology. The regulator overlap is correlational. The cardiac-localised obesity discordance is the cleaner of the two signals.
The 19-gene novel target shortlist
Inclusion criteria, set before looking at the data:
- RNA FDR<0.05 in ≥1 tissue and protein FDR<0.1 in cross-tissue Stouffer meta.
- Not in the forbidden set (SLC2A1, PCSK1, SLC30A8, SLC2A2).
- Composite rank: 1.5 × |Prot_logFC| + 1.0 × |RNA_logFC| + 3.0 × OT_genetic_score + 0.5 × concordant + 0.3 × in_LR_panel.
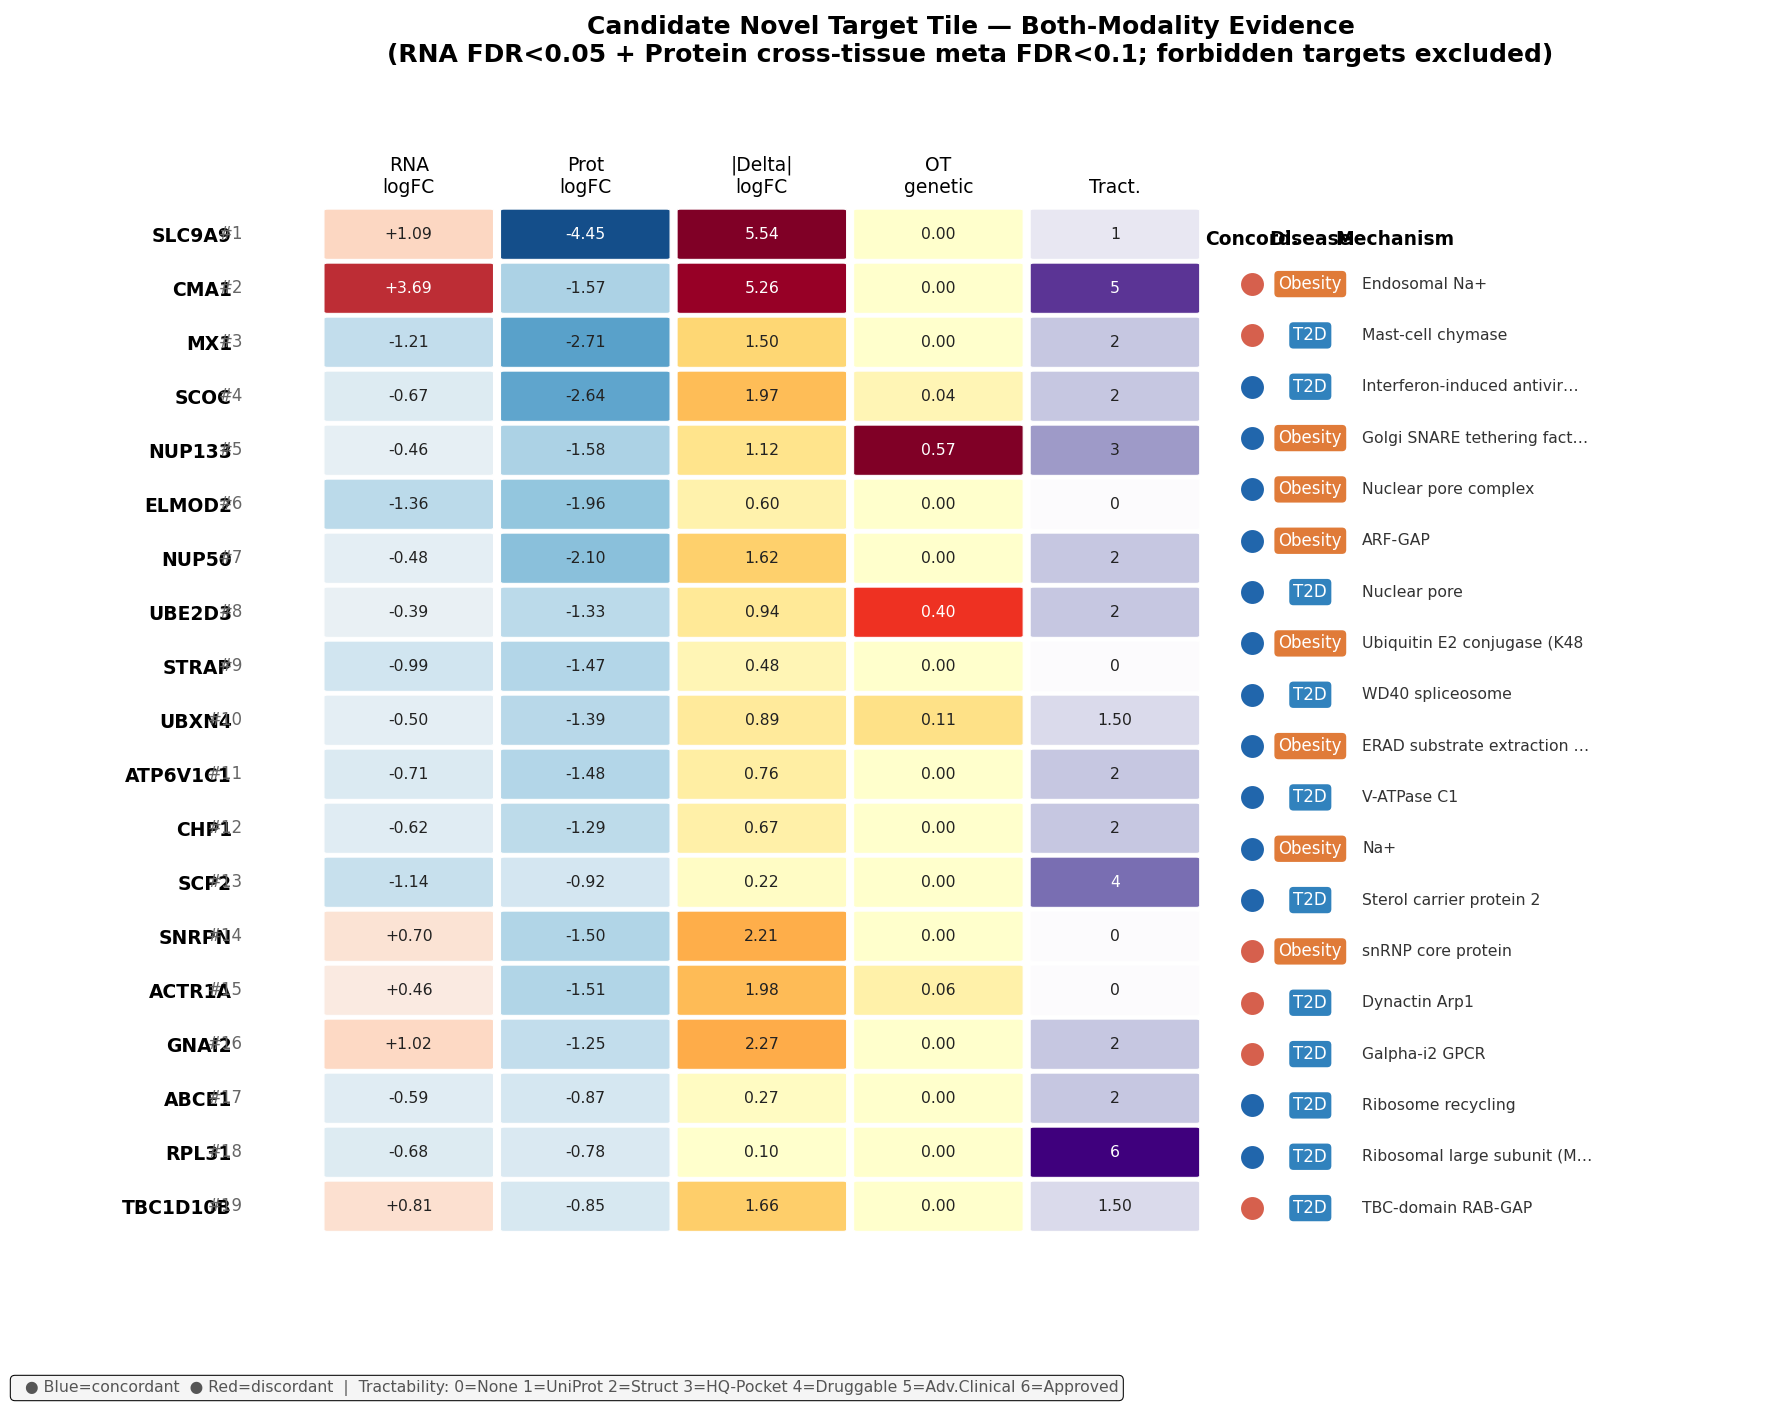
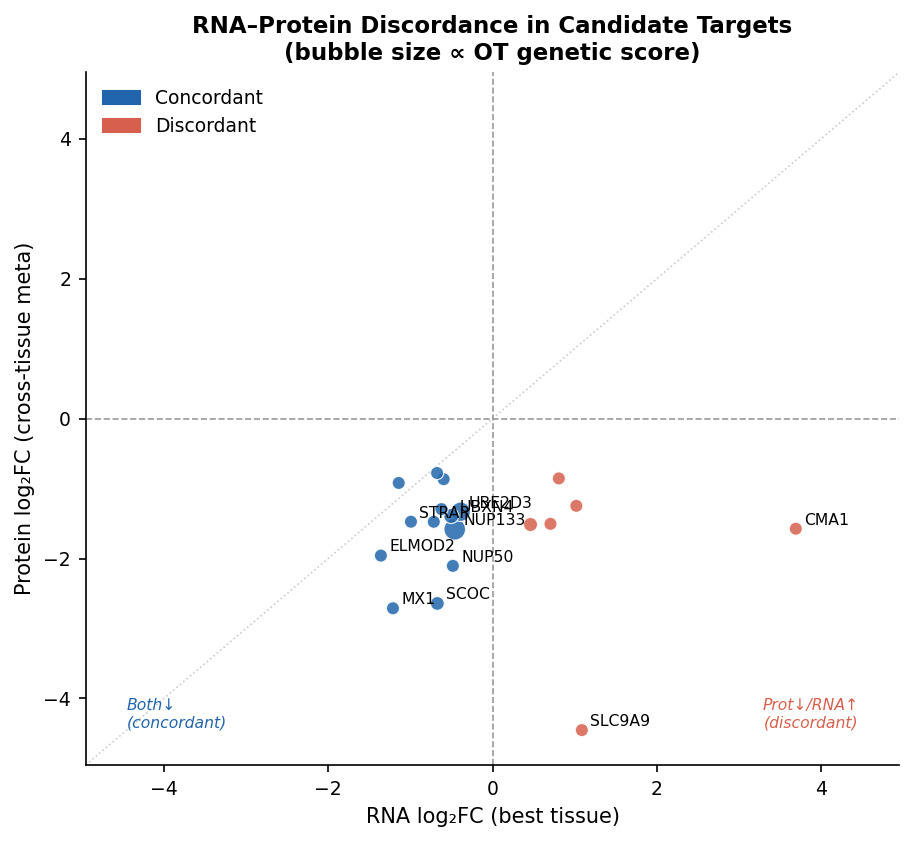
Result: 19 genes. 13/19 concordant in direction across modalities. None overlaps the Zhang et al. DEP headline. Mechanistically the list is not a grab bag — it clusters on three druggable axes and two orthogonal singletons:
| Axis | Genes | Triangulating evidence |
|---|---|---|
| V-ATPase / lysosomal | ATP6V1C1, CHP1, SCOC, TBC1D10B | Lysosome KEGG OR=5.12, FDR=2.1×10⁻¹⁰ in obesity ORA |
| Nuclear pore / mRNA export | NUP133, NUP50 | T2D KEGG RNA Transport NES=−2.19 |
| Ubiquitin-proteasome / ERAD | UBE2D3, UBXN4 | T2D rna_only UPS regulator OR=8.15 |
| Interferon (singleton) | MX1 | Concordant down across 8 tissues; #1 obesity neutrophil-degranulation hit |
| Chymase (singleton) | CMA1 | RNA logFC=+3.69 renal medulla; Advanced Clinical SM tractability |
Top-10 by composite rank
| # | Gene | RNA logFC | Prot logFC | Direction | OT GA | Tractability | Strongest orthogonal evidence |
|---|---|---|---|---|---|---|---|
| 1 | SLC9A9 | +1.09 | −4.45 | Discordant | — | UniProt med-conf | Endosomal NHE9; largest protein effect in dataset; flagged low-coverage (2 tissues) |
| 2 | CMA1 | +3.69 | −1.57 | Discordant | — | Advanced Clinical SM | Mast-cell chymase, non-ACE Ang-I→Ang-II in metabolic kidney |
| 3 | MX1 | −1.21 | −2.71 | Concordant | — | Structure with ligand | IFN-induced GTPase; concordant down in T2D pituitary, 8-tissue meta |
| 4 | SCOC | −0.67 | −2.64 | Concordant | 0.04 | Structure with ligand | Golgi SNARE tethering; Vesicle-Transport Reactome enriched in T2D |
| 5 | NUP133 | −0.46 | −1.58 | Concordant | 0.57 | High-quality pocket | Highest OT T2D GA in shortlist; nuclear pore / RNA export |
| 6 | ELMOD2 | −1.36 | −1.96 | Concordant | — | None | ARF-GAP / lipid-droplet remodelling; 14-tissue protein |
| 7 | NUP50 | −0.48 | −2.10 | Concordant | — | Structure with ligand | Nuclear pore; importin-α recycling |
| 8 | UBE2D3 | −0.39 | −1.33 | Concordant | 0.40 | Structure with ligand | E2 ubiquitin conjugase; 21-tissue protein meta |
| 9 | STRAP | −0.99 | −1.47 | Concordant | — | None | WD40 spliceosome / SMAD modulator |
| 10 | UBXN4 | −0.50 | −1.39 | Concordant | 0.11 | UniProt high-conf | ERAD; p97/VCP cofactor (CB-5083 druggable); largest cardiac obesity discordance |
The remaining nine — ATP6V1C1, CHP1, SCP2, SNRPN, ACTR1A, GNAI2, ABCE1, RPL31, TBC1D10B — extend the same biology, with RPL31 the only Approved-Drug-tractable entry.
Three calls we'd flag for any biopharma triage:
- CMA1 (chymase) — Advanced Clinical small-molecule tractability already exists. The discordant signal (transcript induced ~13×, protein down) in renal medulla under T2D is consistent with a substrate-clearance-vs-induction balance in a kidney that is actively making angiotensin II via a non-ACE route. Chymase inhibitors have been explored in cardiovascular disease; the diabetic kidney is a less-developed indication and the NHP signal here is a hypothesis-generating prompt for a focused histology + activity assay.
- NUP133 — Highest Open Targets T2D genetic association in the shortlist (0.57). Nuclear pore biology is unconventional in metabolic disease but mechanistically consistent with the T2D RNA-export suppression seen at GSEA. Tractability bucket is "high-quality pocket" — early but real.
- UBXN4 / p97-VCP axis — The cardiac-restricted obesity discordance is the strongest internal triangulation in the dataset. p97/VCP itself is druggable (CB-5083 reached clinic). UBXN4 is the cofactor; whether you'd target UBXN4 directly or use it as a biomarker of ERAD load in obese myocardium is a downstream question.
13 of 19 shortlist entries lack OT genetic evidence — for these, ranking is driven by effect magnitude and cross-modality concordance. Six carry an OBESITY-RNA-UNDERPOWERED flag. None of these are independently validated; they are hypotheses, not assets.
Forbidden-target addendum. Per design constraint, SLC2A1, PCSK1, SLC30A8, SLC2A2 were excluded from the headline shortlist. None shows novel mechanism in this NHP atlas that would justify escalation. All four are confirmed by Open Targets v26.03 to carry strong genetic evidence (PCSK1 obesity GA=0.86; SLC2A2 T2D GA=0.89; SLC30A8 T2D GA=0.90 with the R325W protective LoF reported by Flannick 2014) but the NHP data adds no mechanistic novelty beyond what is already published. They remain non-novel for this re-analysis.
Adipose → distal-organ crosstalk: druggable receptors, real caveats
We scored 887 curated CellChat v2 + CellPhoneDB v4 secreted-signalling pairs by the obesity-axis logFC product (adipose ligand × distal receptor). Of those, 61% are flagged druggable. Top adipose→distal pairs:
- LEP → LEPR — combined score 4.88 (brown adipose → liver), 3.35 (BAT→liver alt), 2.49 (visceral→liver). Expected, serves as a positive control.
- GDF15 → RET — combined score 4.61 (visceral adipose → liver). This is the headline novel observation. GDF15 is a clinical molecule (NGM120, in obesity development), but its canonical receptor is GFRAL in the hindbrain. Bulk co-expression of GDF15 with RET in liver under obesity, in this NHP atlas, extends the signalling map — RET is co-receptor for GFRAL but is also expressed independently in peripheral tissues and is itself a clinical target (selpercatinib, pralsetinib). This is hypothesis-grade and worth a focused human-tissue check.
- SERPINE1 → PLAUR — subcutaneous adipose → kidney, 2.09. PAI-1 / uPAR axis; SERPINE1 has clinical inhibitors (TM5614).
- SPP1 → CD44 — subcutaneous adipose → pancreas, 2.48. Osteopontin axis; macrophage-compositional confound.
- IL10 → IL10RA, CCL3 → CCR1 — inflammatory pairs, both likely macrophage-infiltration-driven, not adipocyte-intrinsic. Reported but down-weighted.
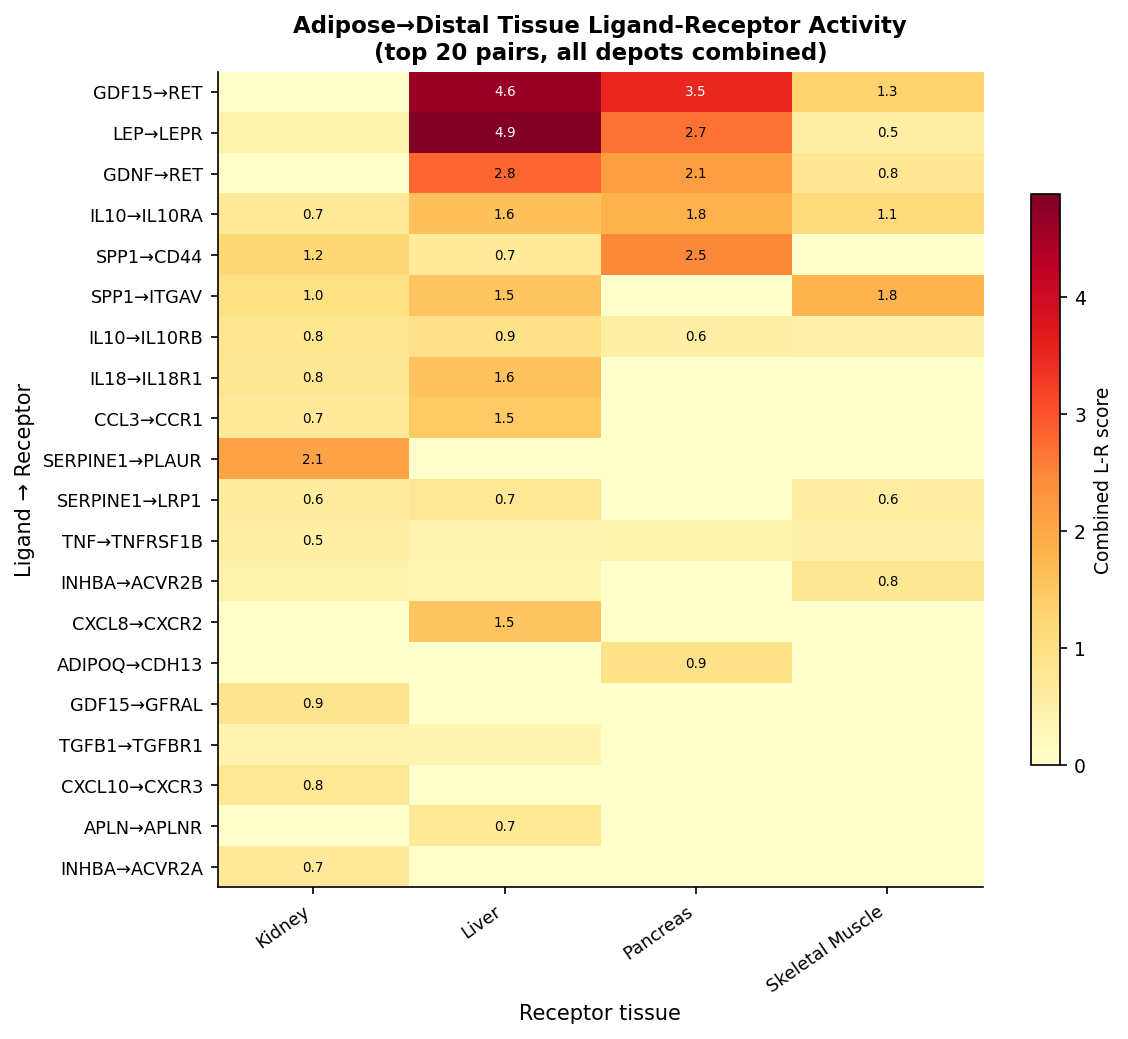
Bulk-resolution caveat is non-negotiable. Co-expression is not signalling. Tissue-composition shifts (macrophage infiltration in obese adipose) confound several inflammatory pairs. We are not reporting these as receptor–ligand interactions; we are reporting them as testable hypotheses ranked for follow-up at single-cell resolution.
The single most reproducible pathway in the dataset: BCAA catabolism
If you ask the data what its strongest cross-disease signal is, BCAA catabolism wins on three independent reads:
- Top shared obesity/T2D signal — Reactome OR=22.8, FDR=7.9×10⁻⁴.
- Top obesity-discordance signal — Reactome OR=85, GOBP OR=111 in the 59-gene cardiac-discordant set.
- Top obesity-only enrichment, replicated across Reactome, KEGG, GO-BP. Co-enriched: propanoate metabolism, KEGG OR=34.4.
BCAA dysregulation in insulin resistance is established (Newgard 2009; Lynch & Adams 2014; White 2021). The novel quantitative observation is its emergence as the single most cross-consistent shared obesity-T2D pathway in an NHP multi-tissue atlas, with discordance localising to the left ventricle. For a translational team this points to a low-risk, high-confidence biomarker and target-engagement axis: BCKDH activation (BT2 and analogues) plus paired same-animal BCAA / BCKA metabolomics is the obvious next experiment.
What's actually limited, and what to do with the rest
Limits we will not paper over
- Orthogonal cohorts — interaction non-estimable; "shared" calls are intersections, not tests.
- Sex stratification is not powered — 1/51 cells passed; we report the power table, not effects.
- Per-tissue protein power is low (n=4–8); FDR<0.1 was required and tissue-restricted hits dilute.
- Discordance interpretation is partly methodological — RNA and protein come from independent within-animal cohorts. The cardiac-localised obesity discordance is the cleaner internal signal.
- L-R inference is bulk-resolution — composition shifts confound inflammatory pairs.
- Single NHP study, no human replication. Ortholog mapping was 92.5% (RNA) / 93.2% (protein); the residual gap is concentrated in LOC-prefixed loci.
- 14/19 shortlist genes lack OT genetic evidence, so ranking is driven primarily by effect magnitude and concordance. Six carry obesity-RNA-underpowered flags. SLC9A9 (rank 1) protein effect rests on only 2 tissues.
Translational read-out: three concrete next steps
- BCAA catabolism — biomarker / target-engagement. Paired BCAA/BCKA metabolomics on the same animals (or a fresh NHP cohort) plus BCKDH phospho-status. Low-risk, high-confidence read-out.
- CMA1 — preclinical hypothesis. Diabetic-kidney chymase activity assay (substrate cleavage + IHC mast-cell quantification) in human T2D nephropathy biopsies. Existing chymase-inhibitor chemistry available.
- UBXN4 / p97-VCP — cardiac proteostasis hypothesis. ERAD-load assay in obese vs lean primate left ventricle; CB-5083-class tool compounds available for target engagement.
NUP133 and the rest of the V-ATPase / nuclear-pore / UPS clusters are earlier-stage. They warrant single-cell or spatial transcriptomic replication before any chemistry investment.
Methods, briefly
- 22-animal MuData (RNA + protein); ortholog mapping via Ensembl + NCBI HomoloGene; 92.5% RNA / 93.2% protein human-symbol coverage.
- Within-cohort limma-voom (RNA, per tissue), limma-trend with cross-tissue Stouffer meta (protein); FDR thresholds documented above.
- Discordance: per-gene-per-tissue 4-class assignment (concordant / rna_only / protein_only / opposite); regulator-overlap enrichment via GO-BP, MSigDB RBP, proteostasis genes.
- L-R: CellChat v2 + CellPhoneDB v4 secreted-signalling pairs, scored by adipose ligand × distal receptor obesity-axis logFC product.
- Open Targets v26.03 for genetic association and tractability buckets.
- Forbidden-target exclusion enforced at the shortlist build step; addendum logic logged.
Acknowledgements. This re-analysis builds entirely on the GSE188418 RNA-seq and the companion proteomics released by Zhang et al., Cell Reports 42:112952 (2023) — Amgen Cardiometabolic Disorders / Genome Analysis Unit. The original dataset is the foundation; everything here is a downstream re-read.
Interested in this kind of analysis?
See how Inflexa runs multi-modality re-analyses from public atlases to structured, hypothesis-grade target shortlists.