Which proteins mark response to melanoma immunotherapy?
A complete Inflexa analysis of PXD006003: three super-SILAC cohorts with no protein significant in any of them, a directional story that turned out to be a sign error the run found in its own output, and a purity audit that separates the one programme worth keeping from the one that cannot be told apart from immune infiltrate.
PXD006003 (Harel et al. 2019, PMID 31495571). Super-SILAC mass-spectrometry proteomics of metastatic melanoma biopsies from patients treated with anti-PD1 or with adoptive transfer of tumour-infiltrating lymphocytes. Six files, 609 MB: five independent MaxQuant protein-group tables and one SDRF sample sheet. Three of the five tables carry patient material and are the ones this analysis uses. PRIDE accession
The other tutorials on this site end with a recovered answer. This one ends with a null, and it is on the site because of what happened on the way there.
The first pass through this deposition found no protein significant anywhere. That is a legitimate result and worth reporting. The run then did what analyses do with a null: went looking for structure at the pathway level, found two coherent programmes, and wrote down which way each one pointed. One of those directional statements was quotable enough to be dangerous. It said the data inverted the conclusion of the paper the data came from.
It also listed, as its own first limitation, the thing that would make that claim wrong. The follow-up run went and tested it. The ratios were stored upside down, nine of sixteen named conclusions flipped, and the disagreement with the source publication turned into agreement.
Then the same follow-up asked the second question the first run had flagged: how much of the remaining signal is response biology, and how much is just how much immune tissue happened to be in each biopsy.
The screenshots below are that session in order, starting with six files and one question. Everything around them was written from the runs' persisted artifacts, and every number names the file it came from in the underlying report, so a screenshot and the paragraph beside it can be checked against each other.
- Nothing reaches FDR significance, anywhere, in any model. Zero proteins below FDR 0.10 in all three cohorts (best adjusted p 0.2298, 0.4453, 0.5408) and zero in the only analysable survival scan (best BH 0.2207 over 4,871 proteins). This does not change before or after any correction on this page.
- The signal is real and unlocalisable. Estimates of the null-proportion run 0.84 to 0.94, implying that roughly 6 to 16% of the measured proteome is non-null. At 16 versus 5 and 20 versus 21, no individual protein can be named.
- The deposited metadata cannot support the analysis the deposition advertises. 82 of 127 experiment columns join to a specimen, no event or censoring field exists for any endpoint, and eight of nine cohort-by-endpoint survival cells are not analysable.
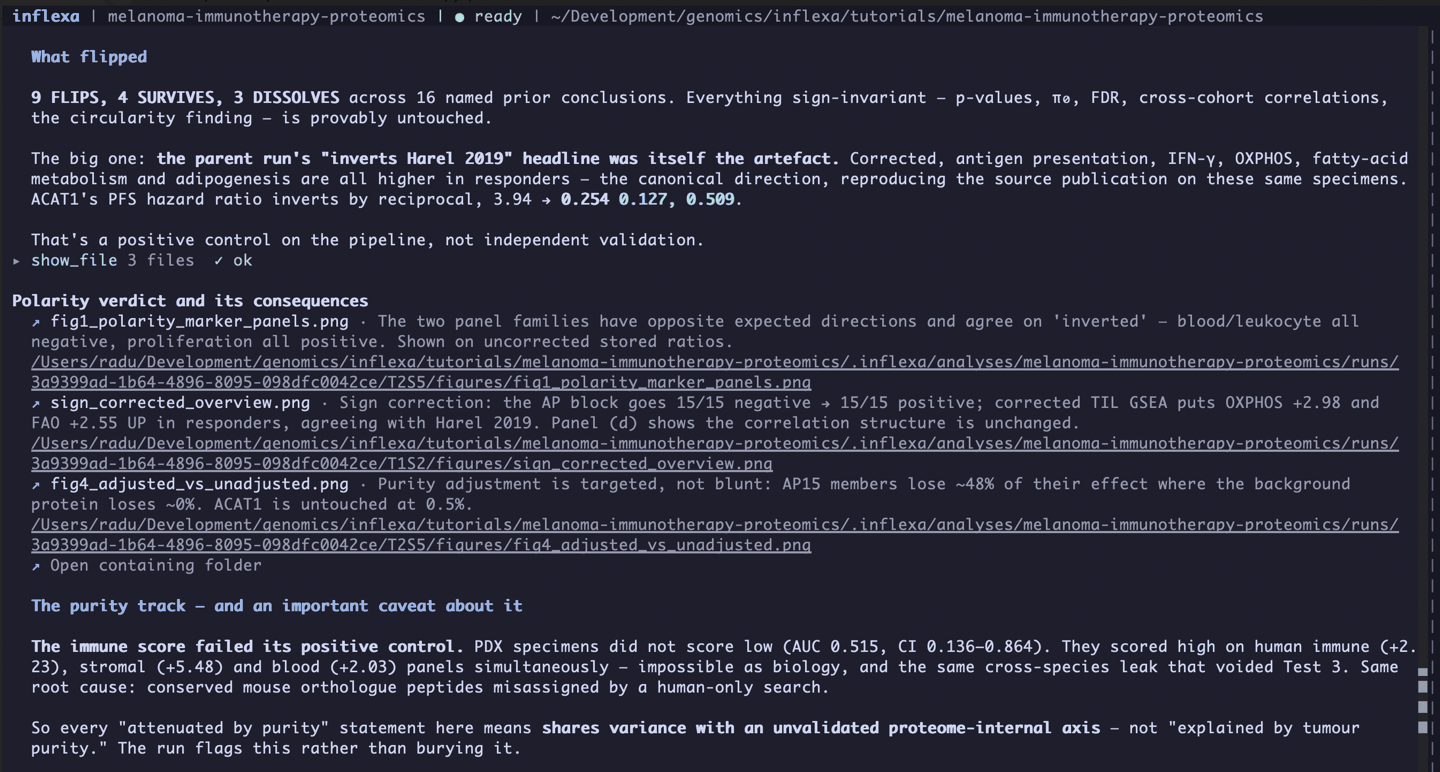
- The stored ratios were inverted. Two marker panels with opposite expected directions both say so, in all three independent searches. Nine of sixteen named conclusions flip sign; every p-value, FDR, null proportion and cross-cohort correlation is provably untouched.
- The most quotable claim in the first pass was the artefact. Corrected, the result agrees with the source publication instead of inverting it. That restores internal coherence and validates nothing externally.
- The purity score built to test the immune signal failed its own positive control and was carried forward flagged. Even so, the antigen-presentation block is 58 to 70% that axis and loses every interferon hallmark set under adjustment, while the metabolic programme is 79 to 95% orthogonal to it and survives.
The dataset, and what is awkward about it
Harel and colleagues profiled melanoma biopsies from two treatment arms and published a metabolic signature of response, with cell-line follow-up behind it. The specimens are good. The quantification is where the trouble on this page starts.
Super-SILAC works by mixing every unlabelled patient specimen with a spiked-in heavy-labelled reference proteome made from cultured melanoma lines. What comes out of MaxQuant is a ratio, and these files carry no label-free columns to fall back on. That has four consequences:
- Every number is a ratio to a shared denominator. A fold change between response groups is a difference of ratios to a common reference, and its magnitude depends on that reference's own content for the protein. A reference-driven artefact reproduces across all three searches and looks like biological consistency.
- The reference contains no immune proteome. It is a mix of cultured tumour lines. Immune-restricted proteins therefore sit near the heavy channel's noise floor, and their ratios are governed by how much leukocyte content each specimen brought with it.
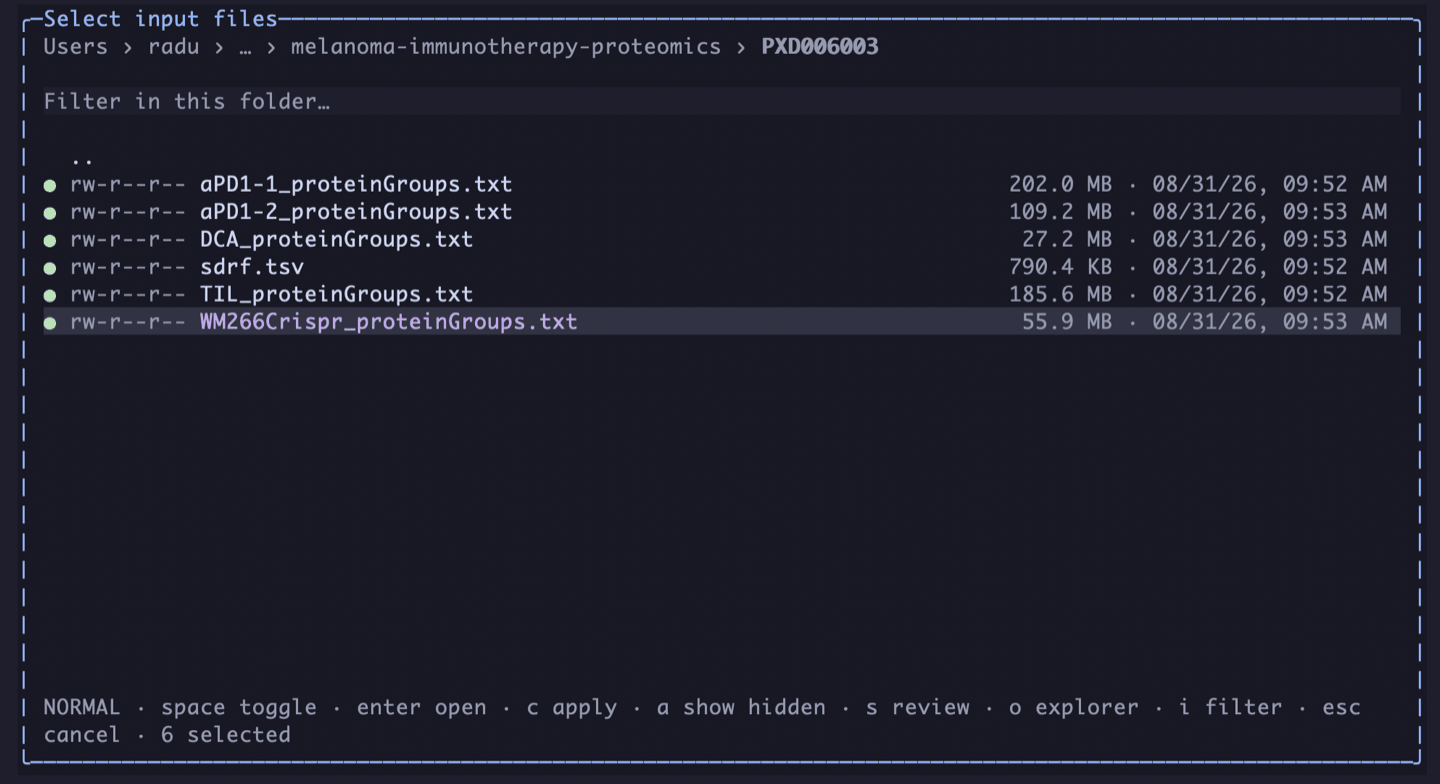
- These are five independent searches, not one experiment. aPD1-1 (50 experiment columns), aPD1-2 (33) and TIL (44) carry the patient and xenograft material. The other two are the paper's own cell-line follow-up: 24 columns from four melanoma lines with and without 30 mM DCA, and 39 columns of CRISPR knockouts in the WM266 line named for ACAT1, CPT1A, FABP7, HADHA and HMGCL against six controls. Protein-group identifiers are not comparable across files, so nothing can be row-bound and every cross-cohort comparison has to run on summary statistics joined by gene symbol.
- The files are wide and the tables are large. aPD1-1 alone carries 747 header columns in 212 MB. The load step reads 61 of them by column selection, so the full table is never materialised.
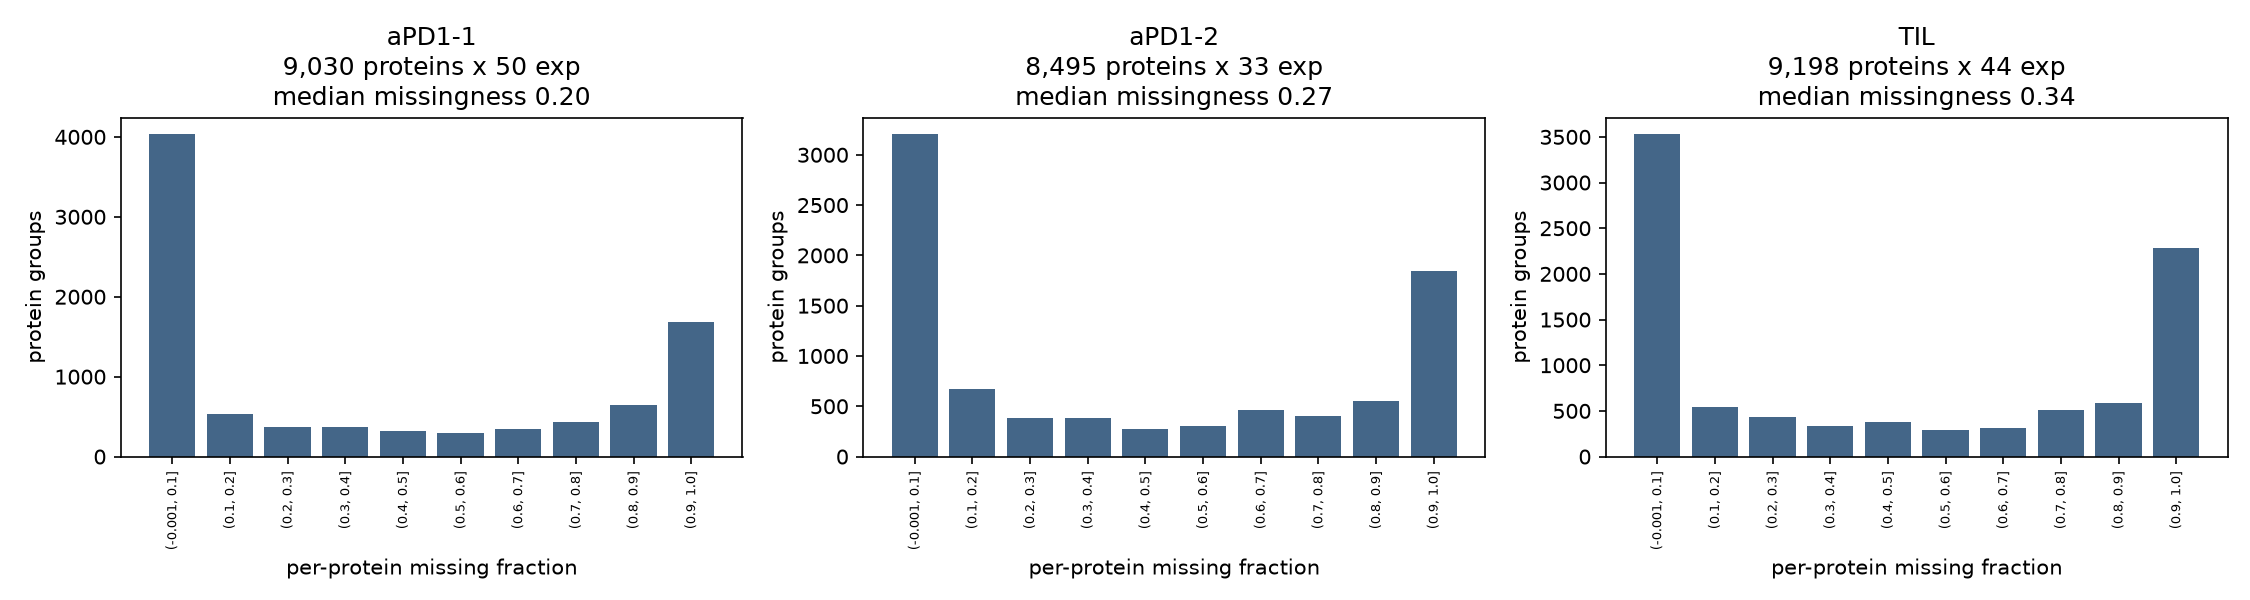
After the standard MaxQuant hygiene filters (reverse hits, potential contaminants, identified-by-site only) the three in-scope searches retain 9,030, 8,495 and 9,198 protein groups, which is 90.2%, 93.4% and 90.6% of input rows. Global linear-ratio medians of 1.11, 1.14 and 1.06 confirm the values arrive on a linear scale, so the log2 is applied exactly once, behind an assertion that refuses to proceed if the median falls outside 0.2 to 5.
Missingness then constrains everything downstream. Median per-protein missingness runs 20%, 27% and 34%, but those medians hide the shape. The distribution is bimodal: a large near-complete mode, a large near-absent mode, and a thin middle. Between 1,684 and 2,278 protein groups per search are missing from more than 90% of specimens.
Before you start
This tutorial assumes Inflexa is installed, the sandbox is provisioned, and a model is configured. If any of that is not true yet, the getting started guide takes about fifteen minutes.
This dataset is heavier than the RNA-seq tutorials. The download is 609 MB and the widest input file is 212 MB, so allow a few gigabytes of disk for inputs and outputs together. Nothing here needs special hardware. The analysis runs R and Python side by side, with limma and the Cox models in R and the loading, scoring and diagnostics in Python.
Make a directory, and start Inflexa in it:
mkdir PXD006003 && cd PXD006003 && inflexaOne thing to know before reading on. There are two runs here, in one analysis directory. The second reads only the first run's persisted artifacts and never touches the raw protein-group tables, which is what makes its audit checkable: every corrected number is a prior number under a stated transformation.
The prompt, and the plan it produced
Six files, selected in one pass and registered together: the three patient searches, the two cell-line searches, and the sample sheet. Nothing is renamed, unzipped or reshaped first.
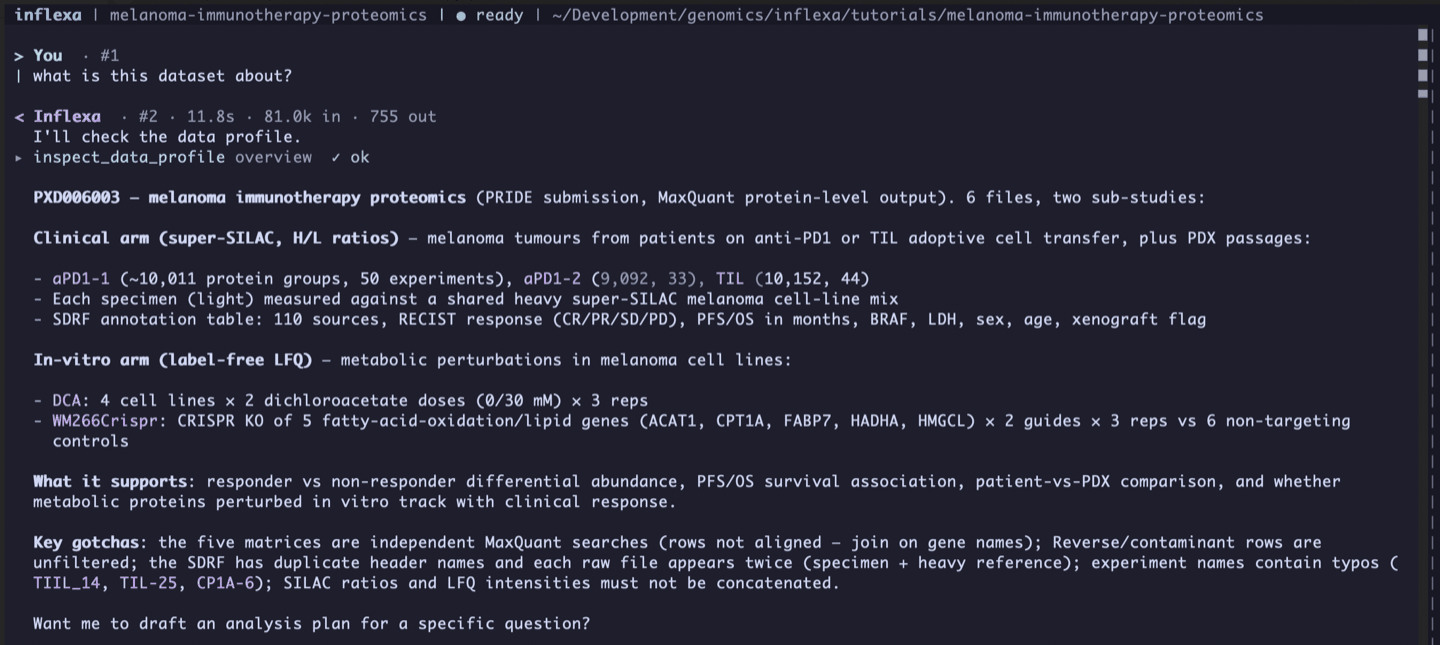
The first question is not the scientific one. It is worth knowing what is in a deposition before deciding what to ask of it.
what is this dataset about?
Under twelve seconds, answered from the data profile that was built when the files were registered. The deposition comes back split into two sub-studies that nobody labelled as such: a clinical arm of super-SILAC ratios covering aPD1-1 at roughly 10,011 protein groups over 50 experiments, aPD1-2 at 9,092 and 33, and TIL at 10,152 and 44; and an in-vitro arm of label-free intensities covering four melanoma lines under dichloroacetate and a CRISPR knockout screen of five fatty-acid and lipid genes.
The four hazards it lists at the bottom are the ones that shape the rest of this page. The five matrices are independent searches whose rows do not align, so joins have to run on gene symbols. Reverse and contaminant rows arrive unfiltered. The sample sheet has duplicate header names and lists every raw file twice, once for the specimen and once for the heavy reference. And the ratios and the label-free intensities must never be concatenated. Every one of those becomes a decision further down, and one of them becomes the whole second half of this page.
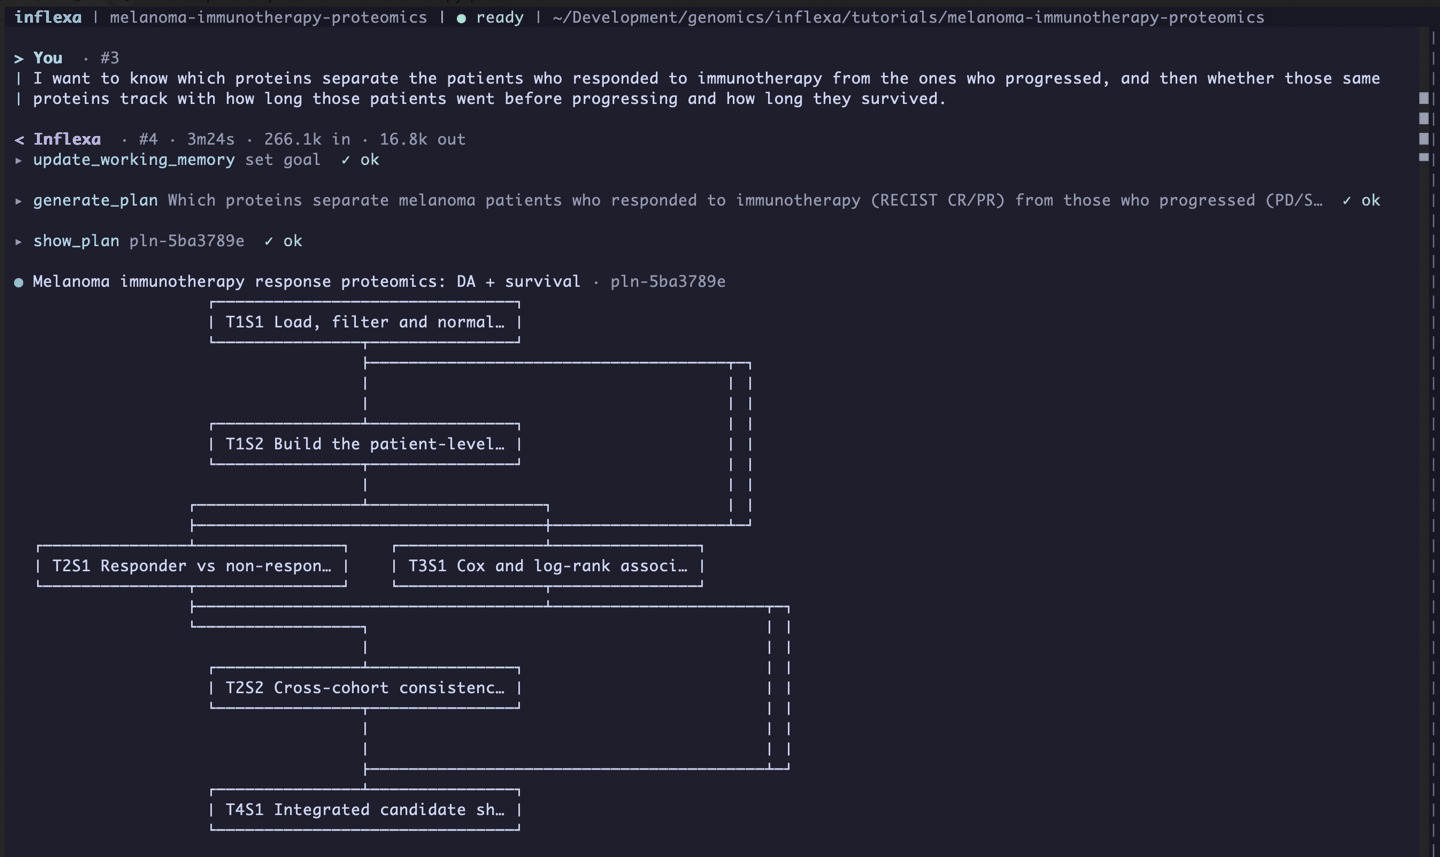
Then the actual request. It names no method, no software, no gene and no threshold. It asks a question and adds a second question that depends on the first one's answer.
I want to know which proteins separate the patients who responded to immunotherapy from the ones who progressed, and then whether those same proteins track with how long those patients went before progressing and how long they survived.
Three minutes and twenty-four seconds later there is a six-step plan across four tracks. Load, filter and normalise; build the patient-level annotation; then a fork into the responder contrast and the Cox and log-rank arm, which rejoin at a cross-cohort consistency step and an integrated shortlist.
The shape of that graph is the answer to the second half of the prompt. Asking whether the same proteins track with survival is a request for a joint claim, and the plan makes the two arms independent and then intersects them, so the place where the two questions meet is a step with a rule in it rather than a sentence at the end.
The plan was approved and executed as run 5a8f439f-38eb-48e7-b8c6-febe171effc2. What comes back is the whole first pass, and the rest of this page unpacks it: the null, the artefact, the survival result that validated nothing, and one candidate protein. The closing half of the same answer sits at the end of section 5, where it does more work than it would here.
what did the analysis reveal?
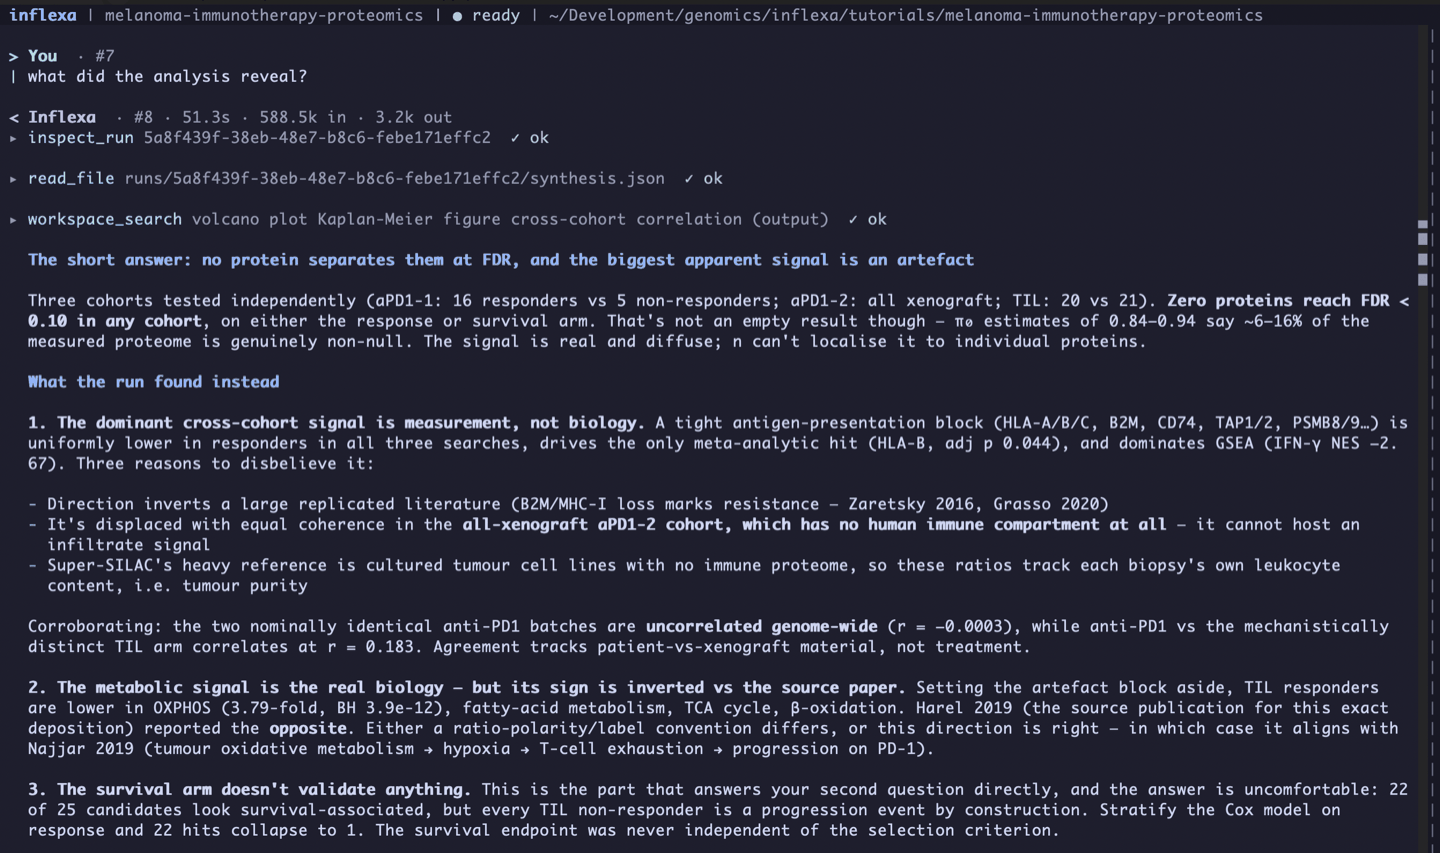
1. What the metadata will actually support
Before any test, the columns in the matrices have to be joined to patients in the sample sheet. This is the step that decides how much of the deposition is analysable at all, and here it removes more than a third of it.
The SDRF has 1,346 data rows across 33 columns, one row per raw file per label channel. 764 of those rows are the super-SILAC heavy reference and they all carry the same source name, so dropping the labelled channel throws away a reagent, not half of every patient. What remains collapses to 109 unique specimens, and no source has internally inconsistent clinical fields, so the collapse is provably lossless.
Two header names are duplicated in the file. Organism appears at positional indices 12 and 13, and modification parameters at 27 through 30, with the second copies empty on all 1,346 rows. The file is read with a raw CSV reader and every column addressed by integer index, so an empty duplicate can never silently shadow a populated one. Small decision, large blast radius if taken the other way.
Then the join, and it does not go well:
- 82 of 127 experiment columns join to a unique specimen. aPD1-1 loses half of its 50 columns to SDRF sources that exist under neither the patient nor the xenograft naming. The deposition has a hole in it, and no amount of normalisation recovers those columns.
- 13 further columns are unresolvable ties. Each matches both a patient and that patient's own xenograft. Response, progression-free survival and overall survival are identical between the two candidates in all 13 cases, so a guess would not corrupt the clinical fields. It would get the model-system flag wrong half the time, and that flag is the variable this whole page ends up turning on, so the 13 were excluded.
- Name normalisation is tolerant but bounded. TIIL_14 matched TIL_14 by collapsing repeated letters, with digits never collapsed so TIL_11 survives intact. TIL-25 normalises cleanly and there is no such source in the sheet at all, so it is recorded as missing and the rule is not loosened to find it something.
- 19 of the 82 matched columns are xenograft. All of them are in the anti-PD1 arm. That leaves 63 patient specimens: 16 responders versus 5 non-responders in anti-PD1, and 20 versus 21 in TIL.
One more finding shapes everything after it. A sweep of all 33 header names for event, status, censor, death, deceased or vital returns nothing. This deposition has no event or censoring indicator for any endpoint. The survival times are there, in months; whether each clock stopped because something happened or because follow-up ended is not recorded anywhere. Progression-free and overall survival are equal for 53 of the 109 specimens, which is what administrative censoring looks like, but nobody decoded a field to learn that and it was not used to synthesise events at this stage.
All 16 SDRF-matched columns of the second anti-PD1 batch are xenografts. Its patient-response comparison is therefore not estimable, with n equal to zero, and by the ordinary reading that cohort is a write-off.
It is not. Conventional patient-derived xenografts have no human immune compartment, so there are no human T cells or macrophages in them and nothing expressing human MHC class II. A cohort that cannot host a tumour-immune infiltrate is a negative control for any claim that a signal is a tumour-immune infiltrate. An annotation problem became the experimental control both runs lean on hardest.
2. Three cohorts, and no protein in any of them
Responders (complete or partial response) against non-responders (progressive or stable disease), fitted per cohort with limma, no pooling, no shared design matrix, no batch term. The three searches are independent MaxQuant runs and their protein groups are not comparable, so there is nothing to pool.
The valid-value filter is stated once and applied identically everywhere: quantified in at least 70% of samples in at least one response group, and at least 3 valid values in each group. The 70% threshold sits at the strict end of the band that was permitted, was fixed before any p-value existed, and was never revisited. It takes the tested sets down to 5,473, 4,911 and 4,871 proteins, which is 61%, 58% and 53% of each matrix.
| Cohort | Design | Tested | Raw p<0.05 | FDR<0.10 | Best adj. p |
|---|---|---|---|---|---|
| aPD1-1 | Patient tumour, 16 vs 5 | 5,473 | 317 | 0 | 0.2298 |
| aPD1-2 | Xenograft only, 8 vs 8 | 4,911 | 383 | 0 | 0.4453 |
| TIL | Patient tumour, 20 vs 21 | 4,871 | 328 | 0 | 0.5408 |
Zero at FDR 0.05 and zero at FDR 0.10, in every cohort. A Wilcoxon test on the identical complete cases also returns zero, so the normal model is not what produced the null. A Perseus-style down-shifted imputation was run as a sensitivity analysis and changed no conclusion, which is why the no-imputation fit stays primary. Imputation correlates with the unimputed fold changes at only 0.82 to 0.84, with individual shifts up to 2.79 log2 units, and that distortion lands on the sparse rows where left-censoring bites hardest.
The confound that would have made imputation dangerous is absent, and somebody checked instead of assuming it. Response groups do not differ in depth in any cohort, at Wilcoxon p of 0.84, 0.43 and 0.42 in table order.
A bare null tells you very little, so the calibration is where the information is. All three cohorts show a mild excess of small p-values over the global null, at 1.16, 1.56 and 1.35 times expectation, with null-proportion estimates of 0.939, 0.837 and 0.940. Somewhere between 6% and 16% of the tested proteome is plausibly non-null. Something is in there; these sample sizes cannot say what.
The second anti-PD1 batch gets its own label instead of being folded in. Its patient stratum is marked not estimable with zero samples, and the 8 versus 8 comparison that does exist is drawn entirely from xenografts. Where its patient volcano would have gone there is a placeholder panel, so the absence sits on disk as a file you can open.
The anti-PD1 patient arm rests on five non-responders. Every p-value there depends on limma borrowing variance across proteins, and the Wilcoxon check has essentially no resolving power against a group of five: all 12 materially discordant calls in that cohort are limma-only.
The confidence intervals show it plainly. The strongest single effect in that cohort spans a range of about 4.7-fold. Meanwhile the only balanced cohort, TIL at 20 versus 21, has the weakest effects in the whole analysis, with a maximum absolute log2 fold change of 1.641. When the best-powered cohort produces the smallest effects, you are looking at an underpowered scan from the inside.
3. Which cohorts agree, and it is not the ones you would guess
With three cohorts and no per-protein hits, the natural next move is to ask whether the weak effects at least agree with each other. The design predicts that the two anti-PD1 batches, being the same treatment, should agree best.
They are the only pair that fails.
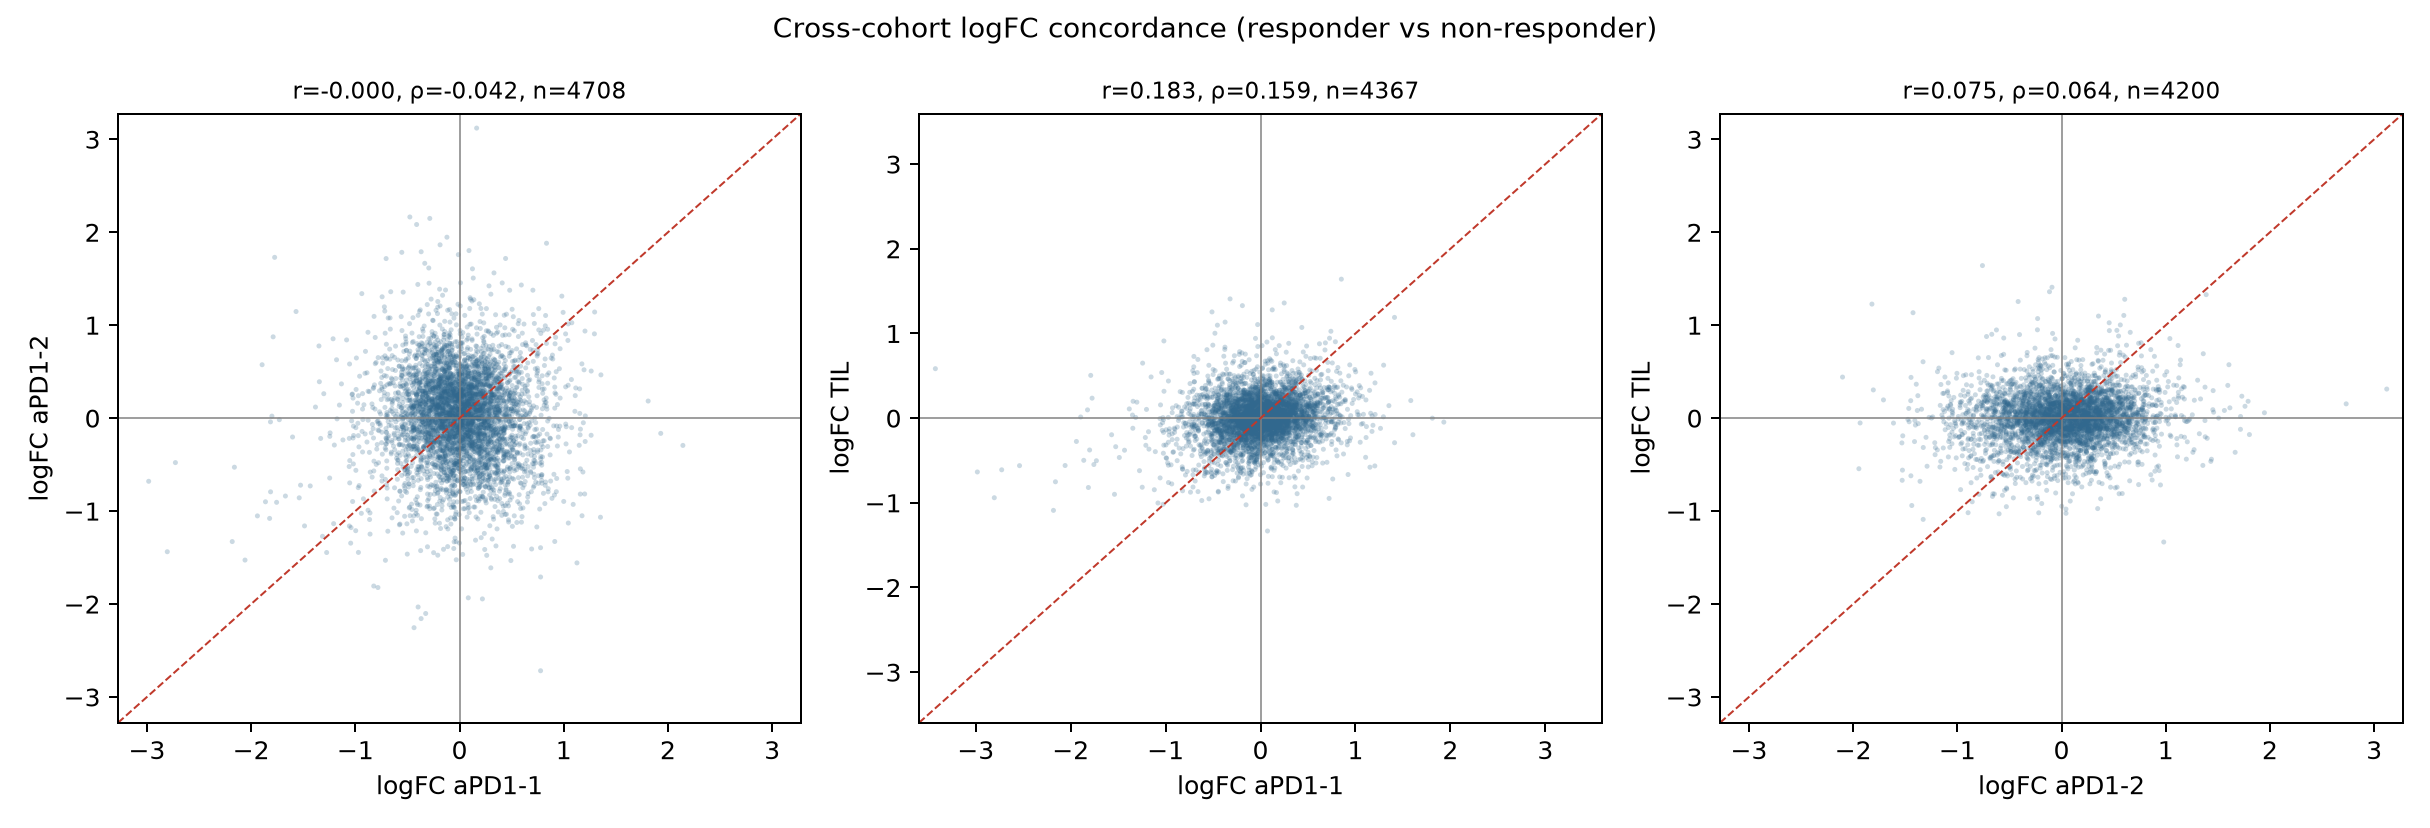
Across 4,708 shared symbols the anti-PD1 pair correlates at r = -0.00033 with a 95% interval of -0.029 to 0.028 and p = 0.982. Sign agreement is 0.4868, which a binomial test cannot distinguish from chance at p = 0.073. Meanwhile aPD1-1 against the mechanistically unrelated TIL arm reaches r = 0.183 with sign agreement 0.5576 at p = 2.9e-14.
The explanation is upstream: the second anti-PD1 batch is entirely xenograft. Human stromal and leukocyte content is lost in xenografts and replaced by mouse, so a patient-versus-xenograft split is expected to dominate a batch-versus-batch split. The practical consequence is that these two batches cannot be treated as replicates of one another, and any pooling across them estimates no single underlying effect.
It also spoils the reassuring heterogeneity statistics. Median between-study heterogeneity across the meta-analysis is 0%, which sounds like agreement, but that statistic measures dispersion relative to each study's own standard error and those errors are large here. Two facts drain the 0% of meaning: the genome-wide correlation between the anti-PD1 batches is zero, and the effect-size scales differ nearly twofold, with fold-change standard deviations of 0.402, 0.491 and 0.276.
The agreement that does exist sits in one narrow place. A block-stratified diagnostic, added beyond the original brief because the correlation pattern needed explaining, finds that a co-regulated set of 15 antigen-presentation proteins (the class I and II HLAs, B2M, CD74, TAP1, TAP2, TAPBP, ERAP1 and the immunoproteasome components) carries almost all of it: r = 0.648 within the block against 0.145 in the remaining 4,329 proteins.
That block is displaced the same way in all three cohorts, with Mann-Whitney p values of 7.6e-13, 2.9e-08 and 9.8e-09 against a whole-proteome mean of essentially zero. Pooling the three cohorts turns the run's zero FDR-significant proteins into one, HLA-B, at a random-effects adjusted p of 0.0438. HLA-B belongs to the block.
The block is also displaced, just as coherently, in the xenograft cohort, which has no human immune compartment and cannot host an infiltrate signal at all. The whole second half of this analysis grows out of that observation. It is also why those 15 concordances are worth roughly one degree of freedom between them: the members are co-regulated and co-quantified, so every enrichment p-value is anti-conservative for the one block it most wants to report.
4. Survival, and the validation that was not one
Three cohorts and three endpoints make nine cells. Eight of them cannot be analysed, and the map of which ones and why is more informative than any hazard ratio on the page.
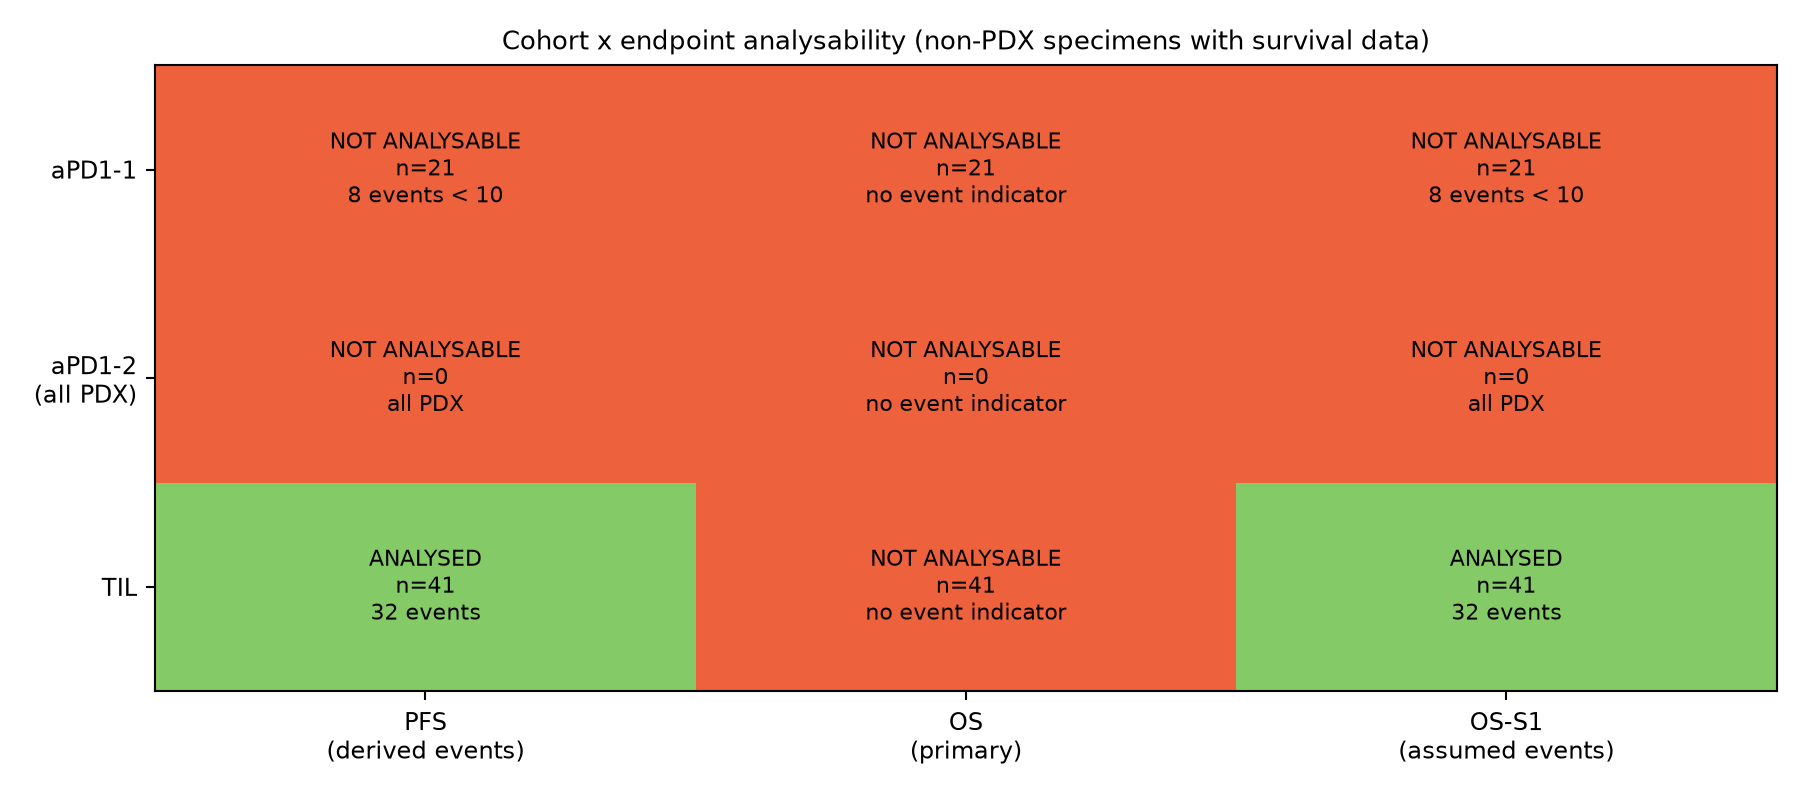
Nobody could read the progression events off a field, so they were derived. Overall survival is always at least progression-free survival, so a strictly shorter progression time means progression was observed, and an equal time means the patient was progression-free when the clock stopped. Since that is inference, it was audited against RECIST before anyone used it: all 26 progressive and stable disease cases come out as events, all 8 complete responses come out censored, and the partial responses split 14 to 14. A correct indicator should behave like that, and this one does.
Overall survival was never fitted. The log states the bounds plainly: the lower bound on events is zero if everyone is alive at last contact, and the upper bound is the number who progressed. There is a sensitivity endpoint that assumes death and progression coincide, labelled as an assumption on every row of every table. It correlates with progression-free survival at 0.89 to 0.96 by construction, so it replicates nothing.
The one analysable cell is TIL progression-free survival, at n = 41 with 32 events. A univariate Cox scan across 4,871 proteins returns zero hits at proteome-wide FDR, with a best adjusted p of 0.2207. Null calibration again shows a real but diffuse excess, 1.41 times expectation with a null proportion of 0.907. Proportional hazards causes no trouble: across 33 leading-protein rows nothing violates, and the smallest test p in the file is 0.134.
Here is the part that earns the section. The 25 proteins carried forward from the differential arm look strongly survival-associated: 22 of 25 reach raw p below 0.05 and 22 of 25 clear a focused FDR over the 25 candidates, with a permutation empirical p of 5e-04 over 2,000 draws. Read at face value, a differential result has just been validated on an independent endpoint.
The endpoint is not independent. Because the event indicator comes out of the survival times, all 21 TIL non-responders are events by construction while only 11 of the 20 responders are. Any protein picked on the responder contrast inherits a hazard ratio for free.
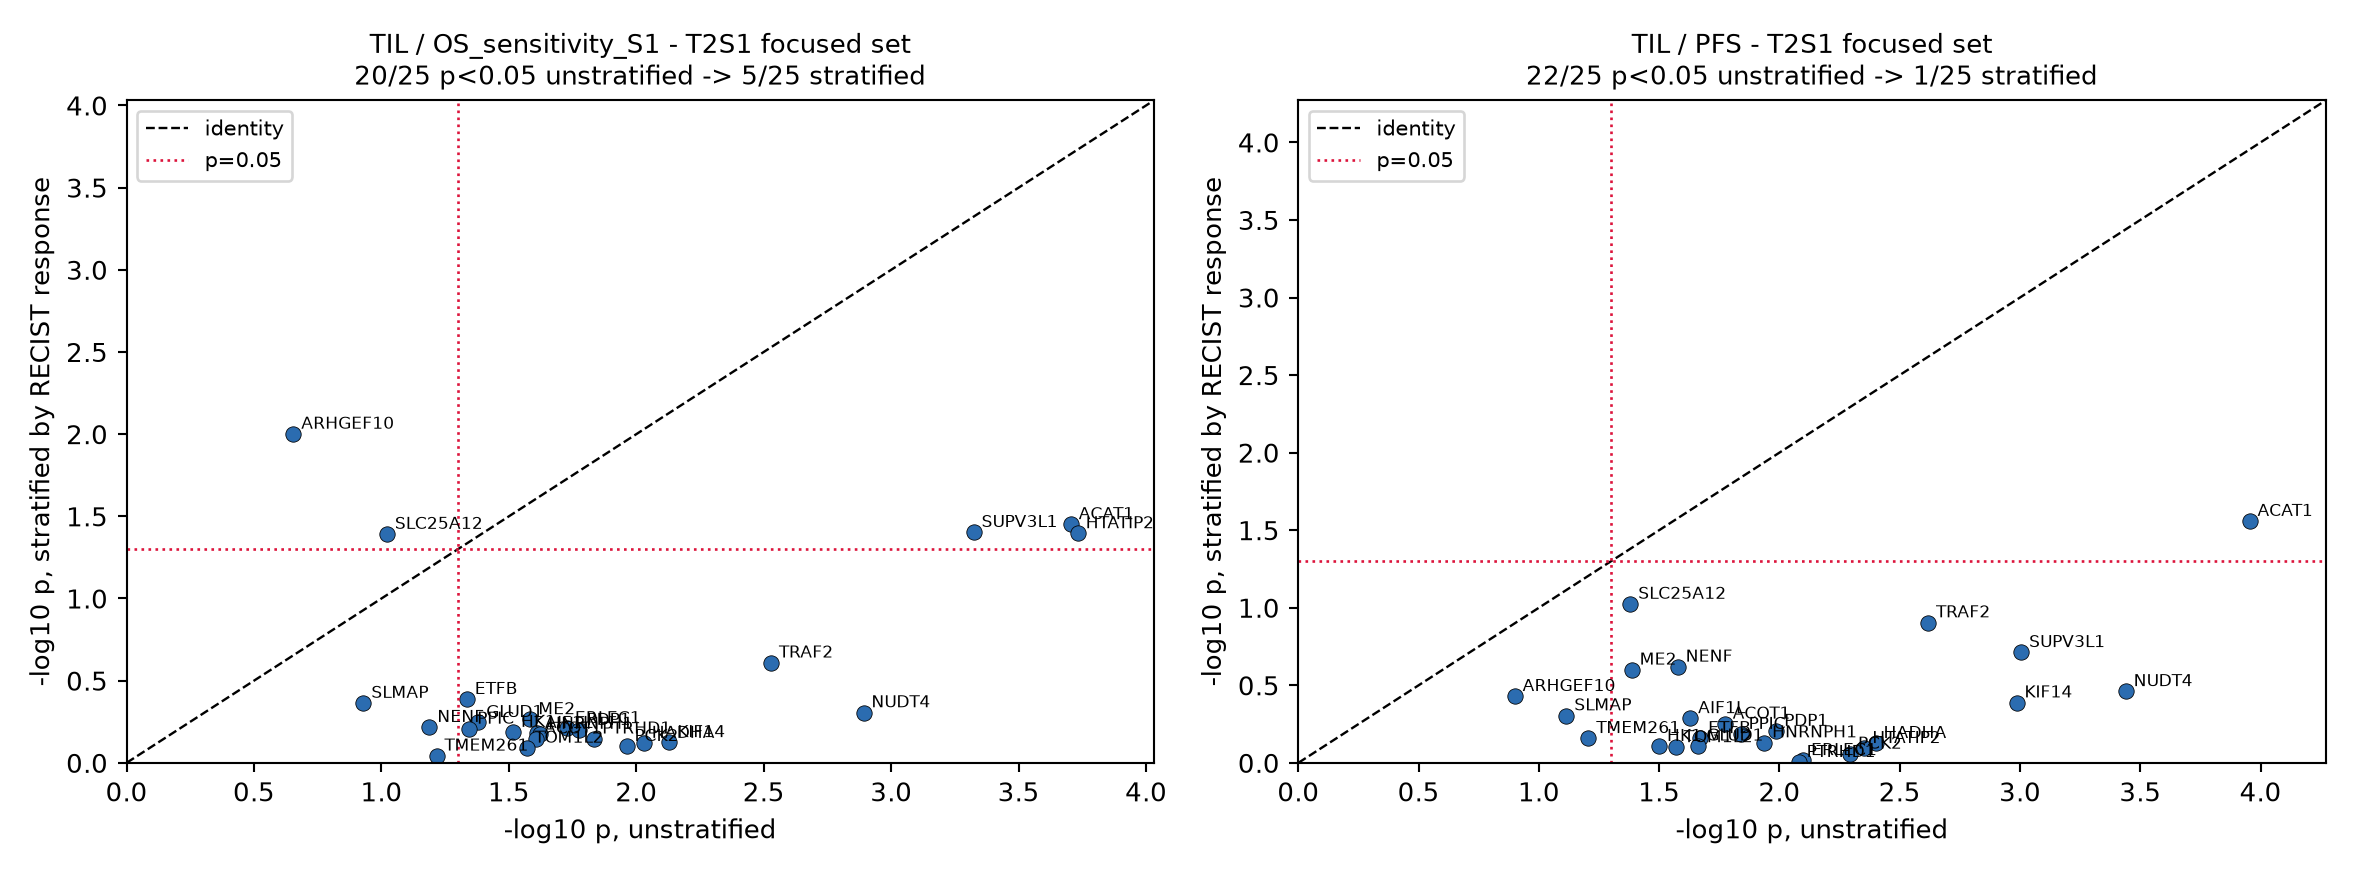
Protein by protein: ACAT1 falls from a hazard ratio of 3.94 at p = 1.1e-04 to 2.375 at p = 0.028 with a focused FDR of 0.692; NUDT4 from p = 3.6e-04 to 0.346; SUPV3L1 from 9.9e-04 to 0.194; HTATIP2 from 4.4e-03 to 0.806; ERLEC1 from 8.0e-03 to 0.963. Every one of them carries a proteome-wide adjusted p between 0.22 and 0.70 regardless of stratification.
The control exists because the discovery and validation endpoints share a variable, and the lesson travels well past this dataset. Select proteins on a response contrast, then validate them on a progression endpoint whose event indicator is itself determined by progression, and you will recover strong-looking survival associations that only restate what you selected on.
5. The short list, written as a file with no rows
The integration step had a rule fixed in code before any counting: an adjusted p below 0.10 in at least one cohort with the same fold-change sign everywhere else it was measured, and a Cox adjusted p below 0.10 for the same cohort, with no cross-cohort borrowing of survival evidence. Short list is the intersection.
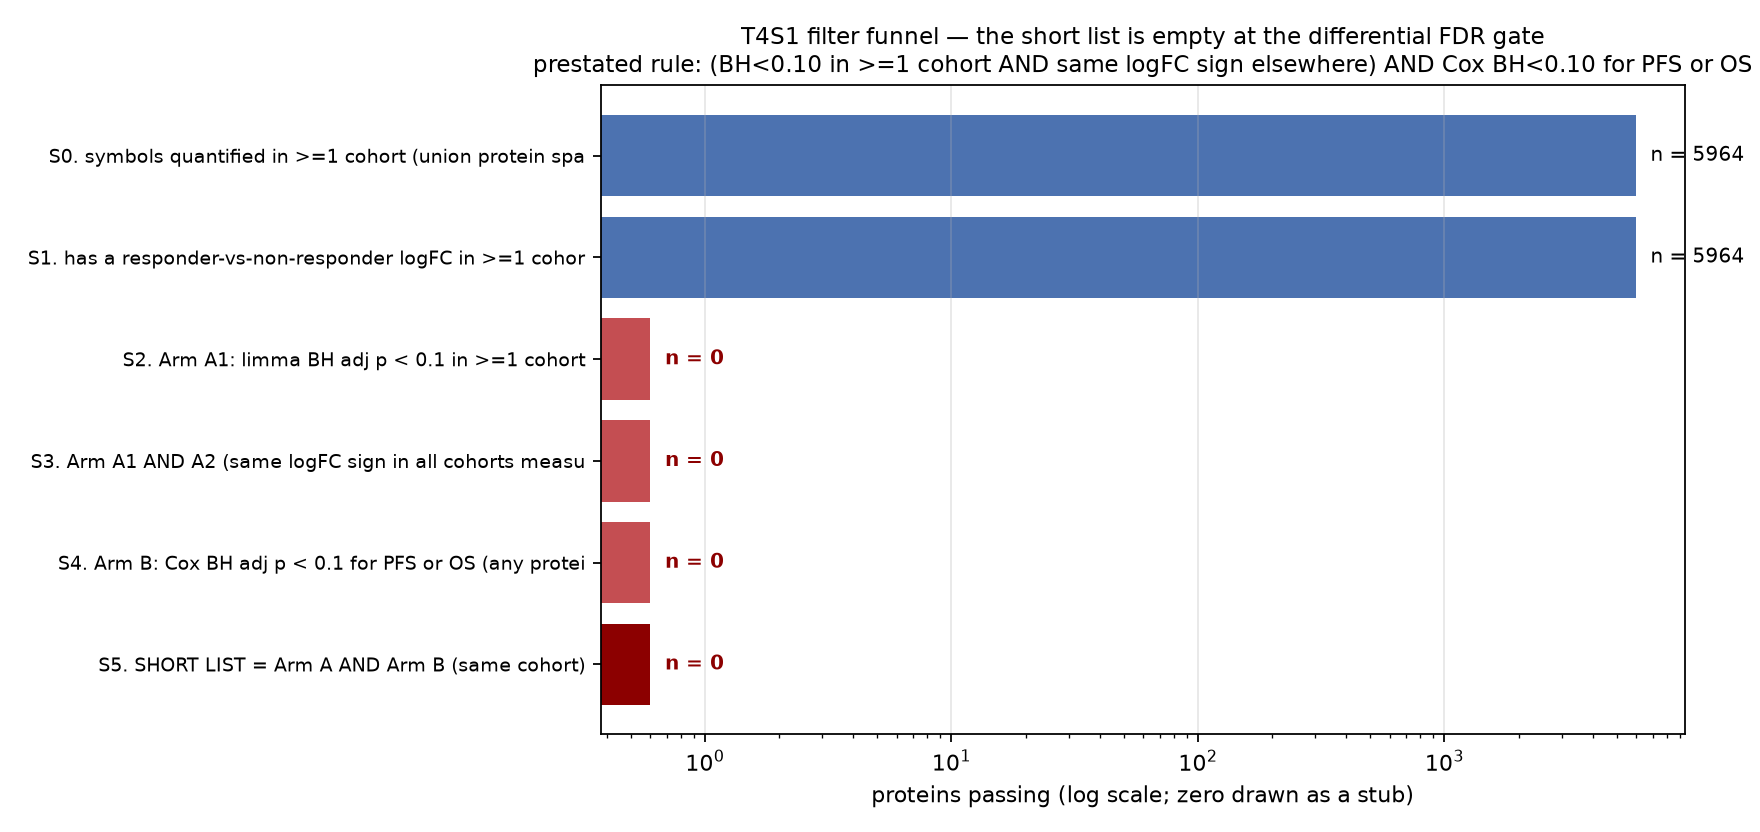
5,964 gene symbols enter and none survive. Two counts are reported alongside, because a reader will want them: 1,602 proteins keep the same direction across every cohort in which they were measured, and 2,435 do so across the two patient cohorts. Under independent signs you would expect 25% by chance, and 1,602 out of 4,134 is close to it. Directional consistency on its own is not evidence.
The step also says something most integration steps leave out. Intersecting two FDR-controlled lists does not control the joint error rate in either direction. It neither preserves the false discovery rate nor gives you a valid combined p-value. Had the intersection come back non-empty, the honest label for it would still have been proteins that ranked well on two related criteria.
With no FDR-defined response set, an FDR-defined enrichment is undefined, so enrichment ran on nominal sub-FDR sets, each labelled as such, against that cohort's own quantified proteome instead of the whole genome. Two coherent programmes came out, and over-representation and rank-based methods both find them:
- Antigen presentation, interferon signalling and allograft rejection. Interferon gamma response reaches 3.0-fold over-representation in the anti-PD1 cohort and a normalised enrichment score of 2.67 on the ranked meta-analytic effect, the strongest set in the analysis.
- Mitochondrial oxidative metabolism. In the TIL cohort, oxidative phosphorylation reaches 3.79-fold at an adjusted p of 3.9e-12, with fatty-acid metabolism, adipogenesis, fatty-acid beta-oxidation and the TCA cycle behind it. The same programme recurs independently on the survival arm.
The run then wrote down which way each one pointed. This is the moment where a re-analysis becomes capable of being confidently wrong.
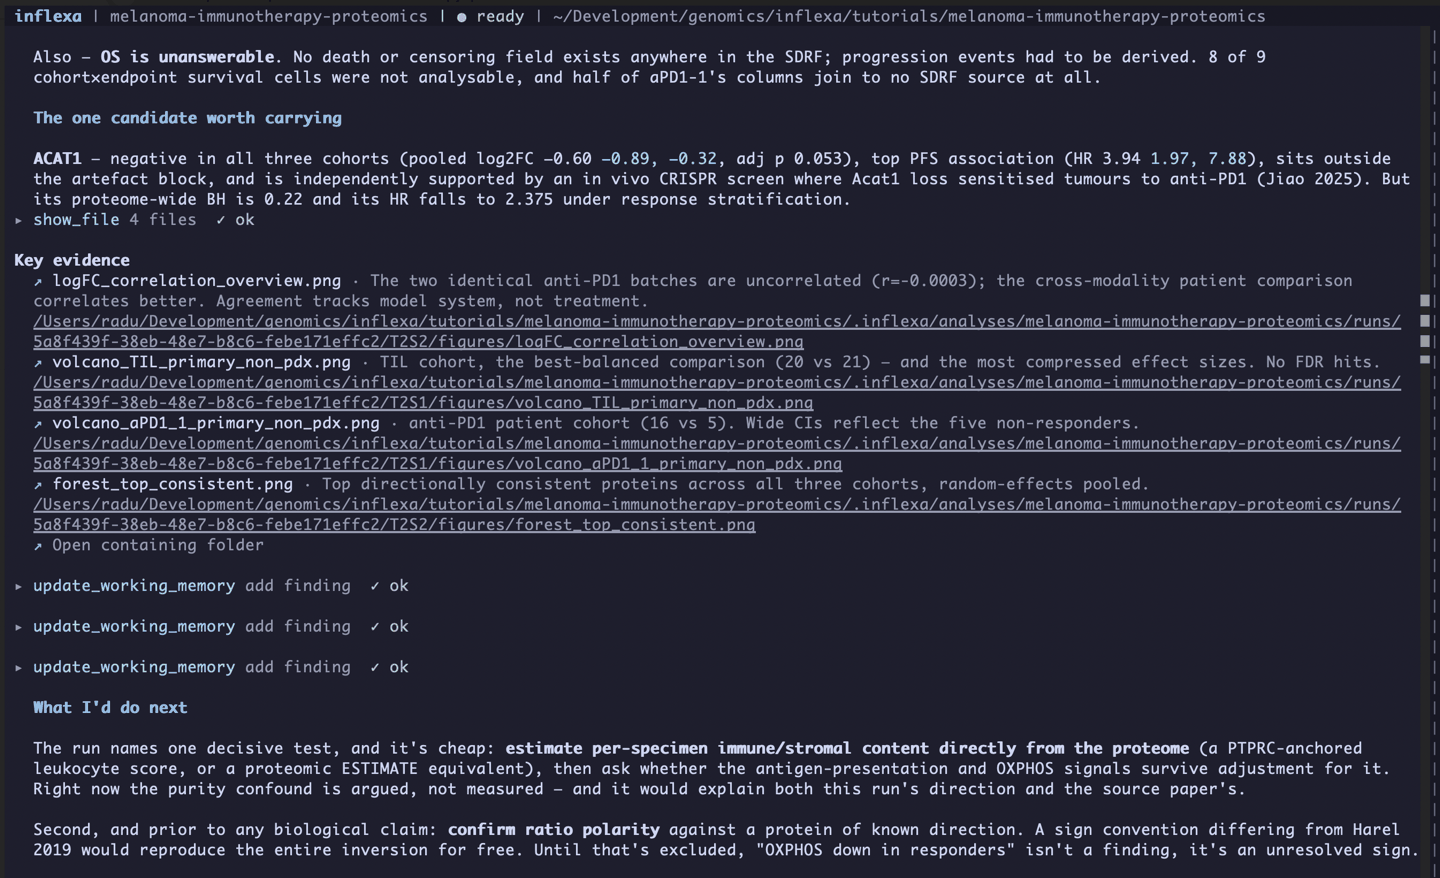
Every value here is a log2 ratio between the specimen channel and the super-SILAC reference channel. Which of the two is the numerator came from an annotation, and nobody tested it. The run's own leading limitation says that a sign convention differing from the source publication's would reproduce the entire directional story it had just reported, for both programmes, and that this has to be excluded before any direction gets described as biology.
Its second limitation says that per-specimen immune and stromal content was never estimated, so the tumour-purity explanation for the antigen-presentation block is an argument and not a measurement, and that a leukocyte-marker score would turn it into a test.
Two named objections to its own headline, both of them falsifiable. The rest of this page is what happened when somebody went and falsified them.
Those two objections are not buried in a limitations file. They are the closing section of the run's own summary, under the heading "What I'd do next", above the one candidate it was willing to carry.
6. Which way round is the ratio?
Both objections, in three words.
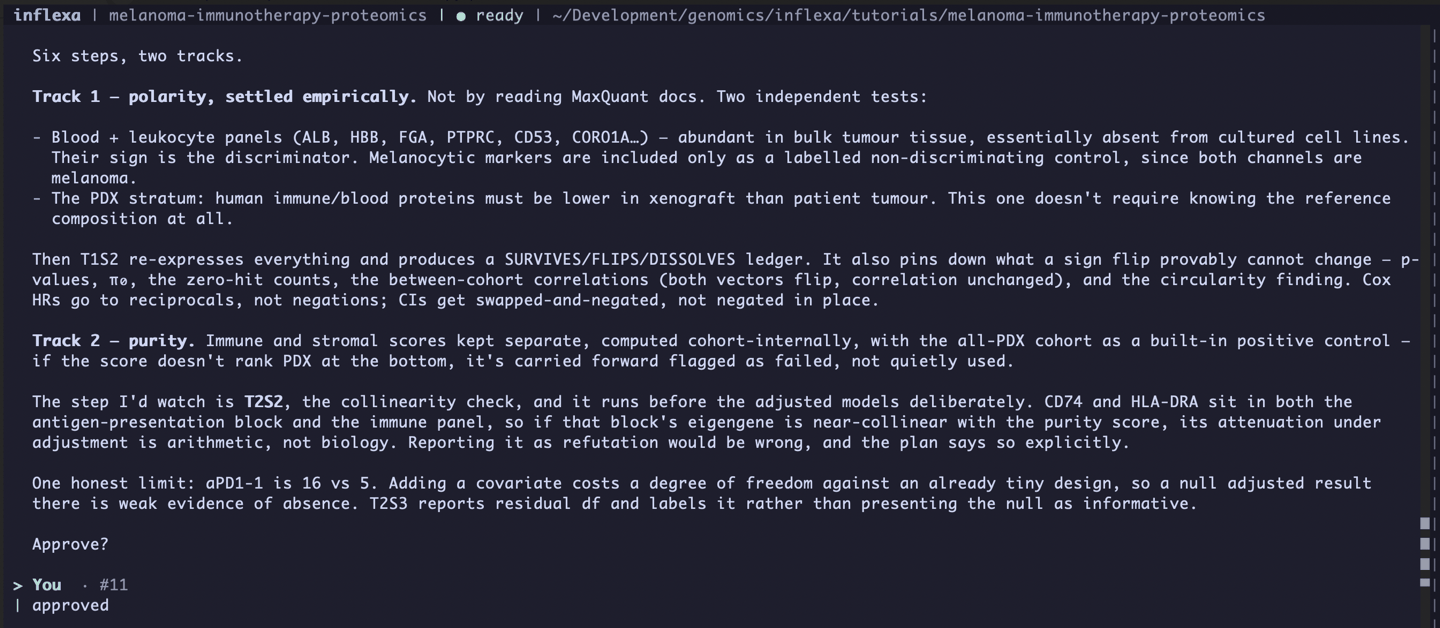
let's do both
Five minutes and seventeen seconds went by before a plan appeared, and most of it was not spent planning. After checking which reference panels were available, the agent went back into the first run's own source: it read the load step's summary, grepped its scripts for the ratio column and for anything mentioning polarity or inversion, read the first sixty lines of the loader, then grepped the sample sheet for the label assignment. Then it stopped and said it had found the bug before writing the plan meant to look for it.
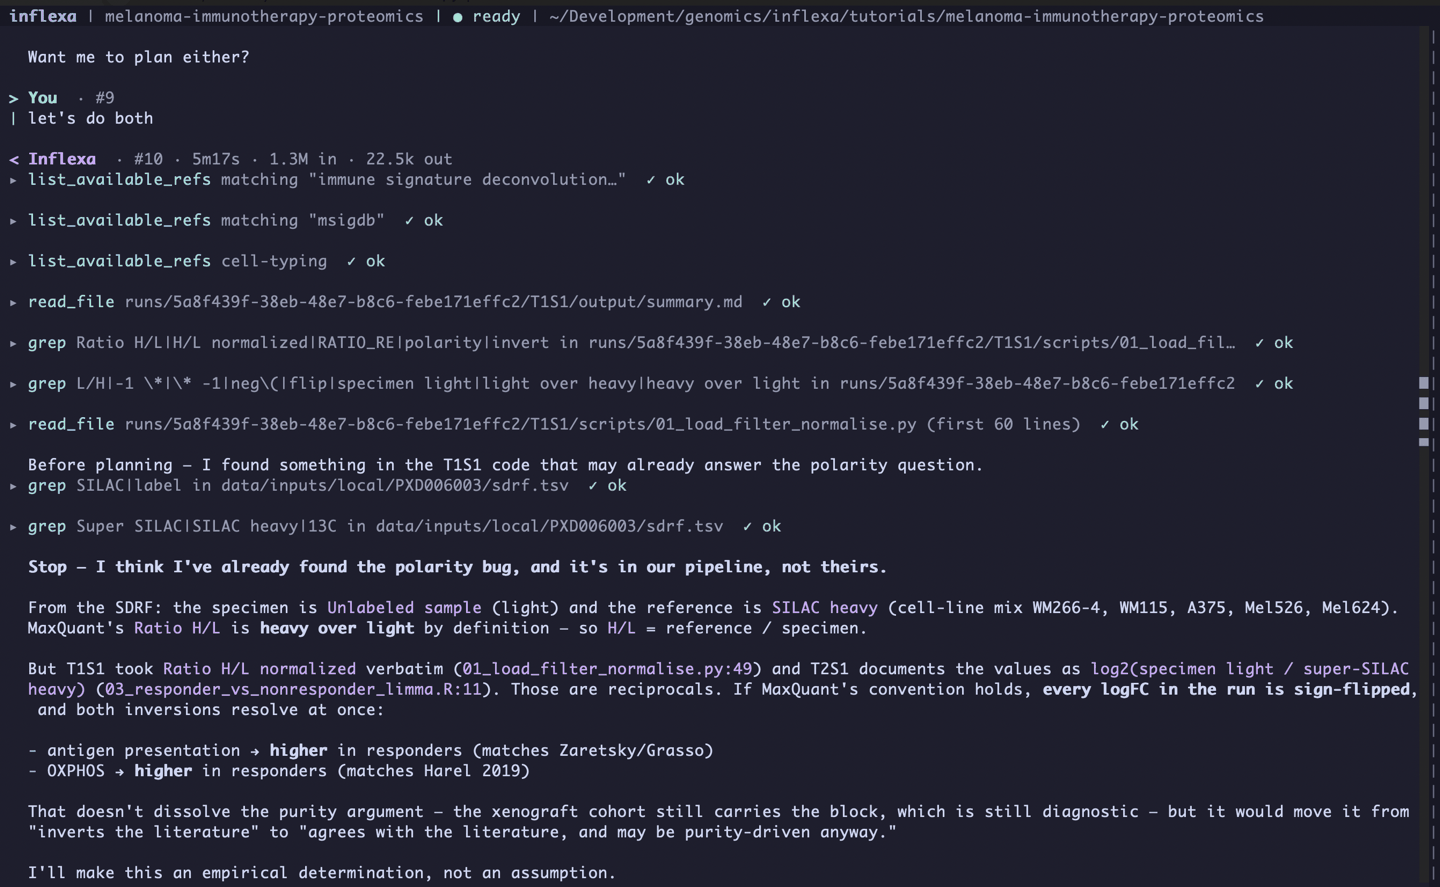
The finding is a two-line contradiction inside the first run, and both lines are in the package. At 01_load_filter_normalise.py:49 the loader selects MaxQuant's heavy-over-light normalised ratio columns and applies no reciprocal. At 03_responder_vs_nonresponder_limma.R:11 a comment documents those same values as the log2 of specimen over reference. Heavy over light is heavy over light by definition, and the sample sheet puts the patient specimen in the unlabelled channel and the super-SILAC melanoma mix in the heavy one. The two statements are reciprocals. One of them is wrong, and the one that is wrong is a comment, which is why nothing downstream ever complained.
That is enough to know the answer and not enough to act on. A comment is not evidence, and a convention read out of documentation can be wrong about a particular file. So the documentary reading was converted into a prediction, and the plan built to test it was allowed to contradict it.
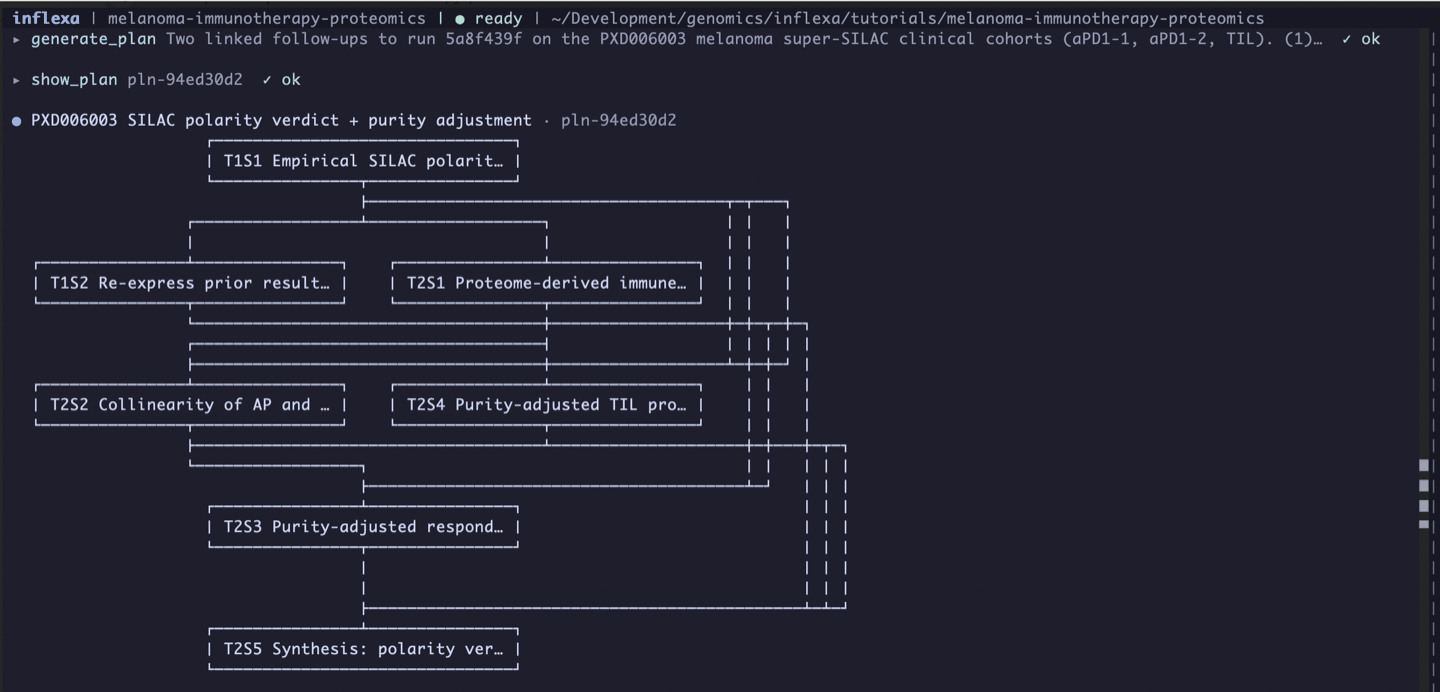
The plan narrates itself before asking for approval, and three of its paragraphs are decisions, not descriptions. Polarity gets two panels whose expected signs oppose each other, so no single artefact can satisfy both. The purity scores are kept as separate numbers, computed within cohort, with the all-xenograft cohort as a positive control that is allowed to fail loudly. And the collinearity check is deliberately scheduled before the adjusted models, because CD74 and HLA-DRA belong to both the block being tested and the score doing the testing, and an attenuation you cannot distinguish from arithmetic must not be reported as a refutation.
The last paragraph before the approval prompt is a limitation, stated while the result could still have gone either way: the anti-PD1 cohort is 16 against 5, a covariate costs a degree of freedom it can barely afford, and a null adjusted result there will be weak evidence of absence. Sections 9 and 10 of this page are the collinearity decision and that limitation playing out.
The design is to score marker panels whose direction biology already tells you. If the stored value is specimen over reference, then blood and leukocyte proteins in a blood-perfused, immune-infiltrated tumour biopsy should come out strongly positive against a denominator made of cultured cell lines that contain none of them.
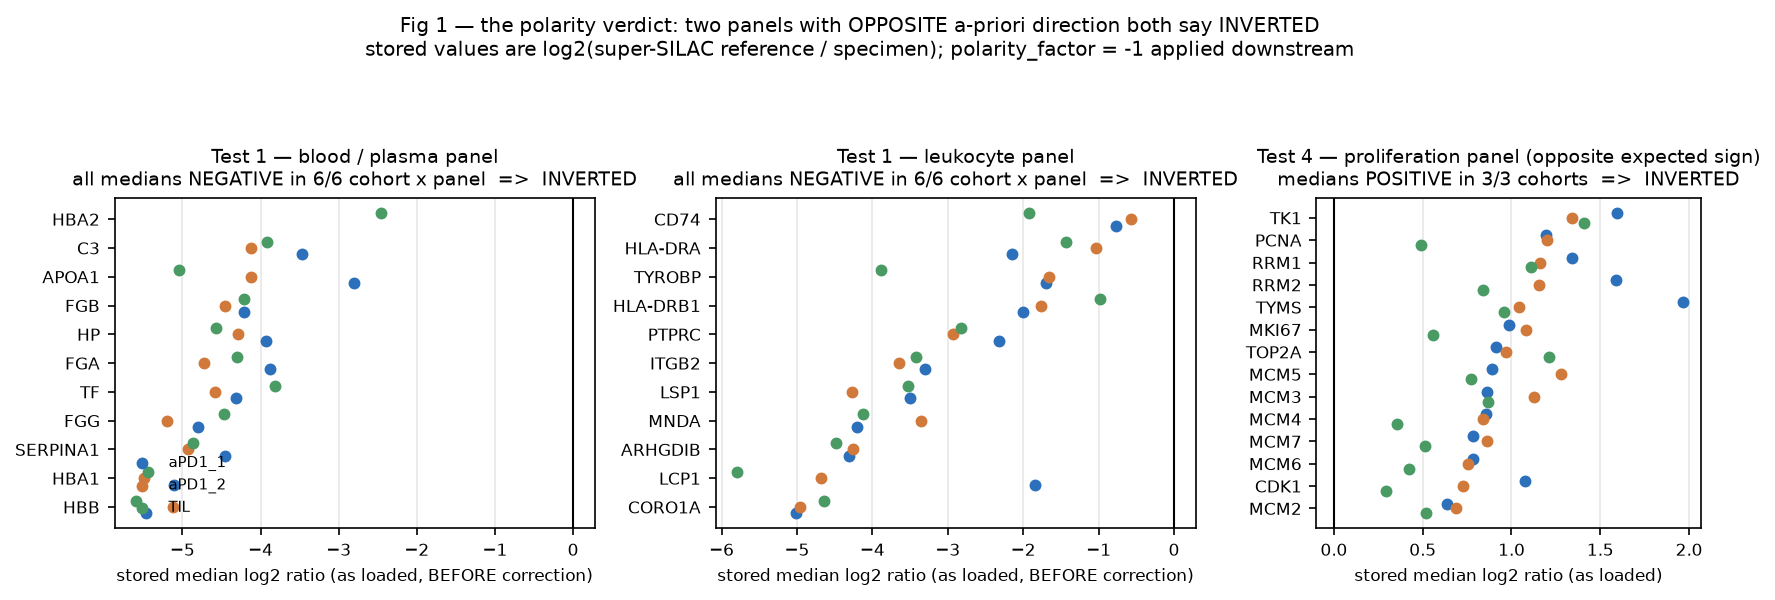
The blood and leukocyte panels are negative everywhere, with medians of -2.3 to -4.7 log2 units. Taken at face value under the documented orientation, that would require the cultured melanoma reference mix to contain 5 to 26 times more haemoglobin, fibrinogen, haptoglobin and CD45 than blood-perfused, immune-infiltrated patient tumour tissue. Nothing marginal about that call. It is biologically impossible.
A further panel was added after two of the tests conflicted, and it was chosen so its expected direction is the mirror of the tissue panels: cell-cycle and replication proteins, far more abundant in exponentially growing cultured lines than in stroma-diluted bulk tumour. Under the correct orientation those should be positive, and they are, in all three cohorts, at medians of +0.88, +0.85 and +0.56 with sign-test p values between 4e-04 and 2.6e-03. TYMS, TK1, RRM1, RRM2, PCNA, MKI67, TOP2A and every MCM subunit point the same way.
A melanocytic marker panel ran too, and its verdict is recorded as non-discriminating by construction, since both channels are melanoma. It shows near-complete detection and no sign bias, which is how an uninformative panel should look. Worth reporting for that reason alone.
The verdict is a polarity factor of -1: the stored values are the log2 of reference over specimen, and the comment in the differential-expression script had it backwards. That is the same answer the agent read out of the code before the plan existed, arrived at by a route that never consulted the code. The agreement is what makes it a verdict. A test whose answer was fixed in advance would have been a formality, and this one was not: a third test in the same step came back pointing the other way.
OK, let's see what this run revealed.
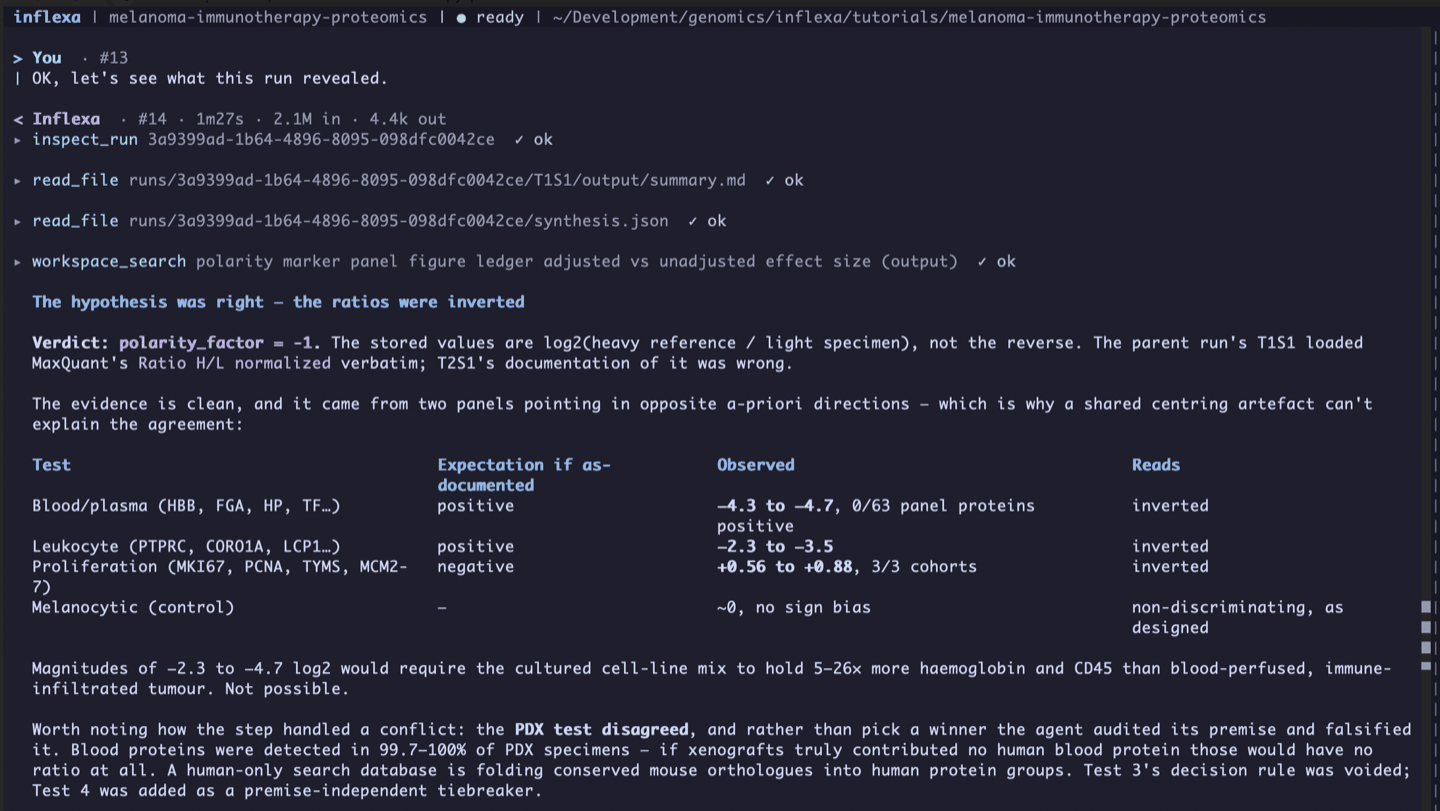
A third test was specified: xenografts should be lower on human blood and leukocyte panels than patient tumours, because they have no human immune compartment. It ran, it produced clean effect sizes, and it pointed the opposite way from the other two.
The conflict was not resolved by preferring one result. The premise of the third test was checked against the data and falsified: blood-panel proteins are detected in 99.7 to 100% of xenograft specimens. If the premise held they would carry no ratio at all. A human-only search database is assigning conserved mouse plasma and erythrocyte peptides into human protein groups, so that panel does not measure human blood content in xenograft material.
An orientation-free control confirms the strata are genuine: lineage-restricted markers really are depleted in the xenografts, with TYROBP detected in 0% of them against 13.6% of patient specimens. The third test stays in the record with its full effect sizes, intervals and p-values, and feeds nothing into the verdict, because its decision rule is void.
7. Nine conclusions flip, and everything else provably does not
Multiplying every stored ratio by -1 is a one-character change with a very large surface area, so the correction was applied as a typed transformation with a rule assigned to every column of every file, and then as a ledger over every named prior conclusion. The verdict is 9 flips, 4 survives, 3 dissolves over 16 conclusions.
The typing matters more than it sounds. Fold changes, moderated t statistics, group means and Cox coefficients get negated. Confidence intervals get swapped and negated together, so an interval stays ordered and stays centred on its transformed estimate. Hazard ratios take a reciprocal, because negating a hazard ratio is meaningless. Harrell's concordance becomes one minus itself. Four different rules, and using the wrong one anywhere would have produced a corrected number that still looked plausible.
| Quantity | As first reported | Corrected | Unchanged |
|---|---|---|---|
| Antigen-presentation block, aPD1-1 | mean logFC -1.399 | +1.399 | Mann-Whitney p 7.6e-13 |
| HLA-B, random-effects meta | -1.409 [-2.030, -0.788] | +1.409 [+0.788, +2.030] | adjusted p 0.0438 |
| GBP1, aPD1-1 | -2.983 [-4.239, -1.728] | +2.983 [+1.728, +4.239] | p 5.5e-05, rank 1 of 5,473 |
| ACAT1, random-effects meta | -0.603 [-0.885, -0.321] | +0.603 [+0.321, +0.885] | adjusted p 0.0529 |
| ACAT1, TIL progression-free survival | HR 3.935 [1.965, 7.883] | HR 0.254 [0.127, 0.509] | Wald p 1.1e-04, BH 0.2207 |
| Interferon gamma, anti-PD1 ranking | NES -2.666 | NES +2.645 | q unchanged, same 25 leading-edge genes |
| Oxidative phosphorylation, same ranking | NES -1.804 | NES +1.804 | q 0.0070 to 0.0069, same 66 genes |
Under the corrected orientation a positive fold change means higher in the responder. The antigen-presentation block now comes out higher in responders in all three cohorts, the canonical direction. Interferon signalling is up in responders. So are oxidative phosphorylation, fatty-acid metabolism and adipogenesis. Higher ACAT1 now means slower progression, not faster.
Enrichment was recomputed from scratch instead of relabelled, which was necessary in principle and dull in practice. On a tie-free continuous statistic, multiplying by -1 is a strict rank reversal, so the leading edge of every one of the 50 hallmark sets comes back identical, no gene enters or leaves any of them, and only the enrichment score's sign moves. Recomputing was still the right call. That identity holds for this transformation and is not a licence to relabel in general.
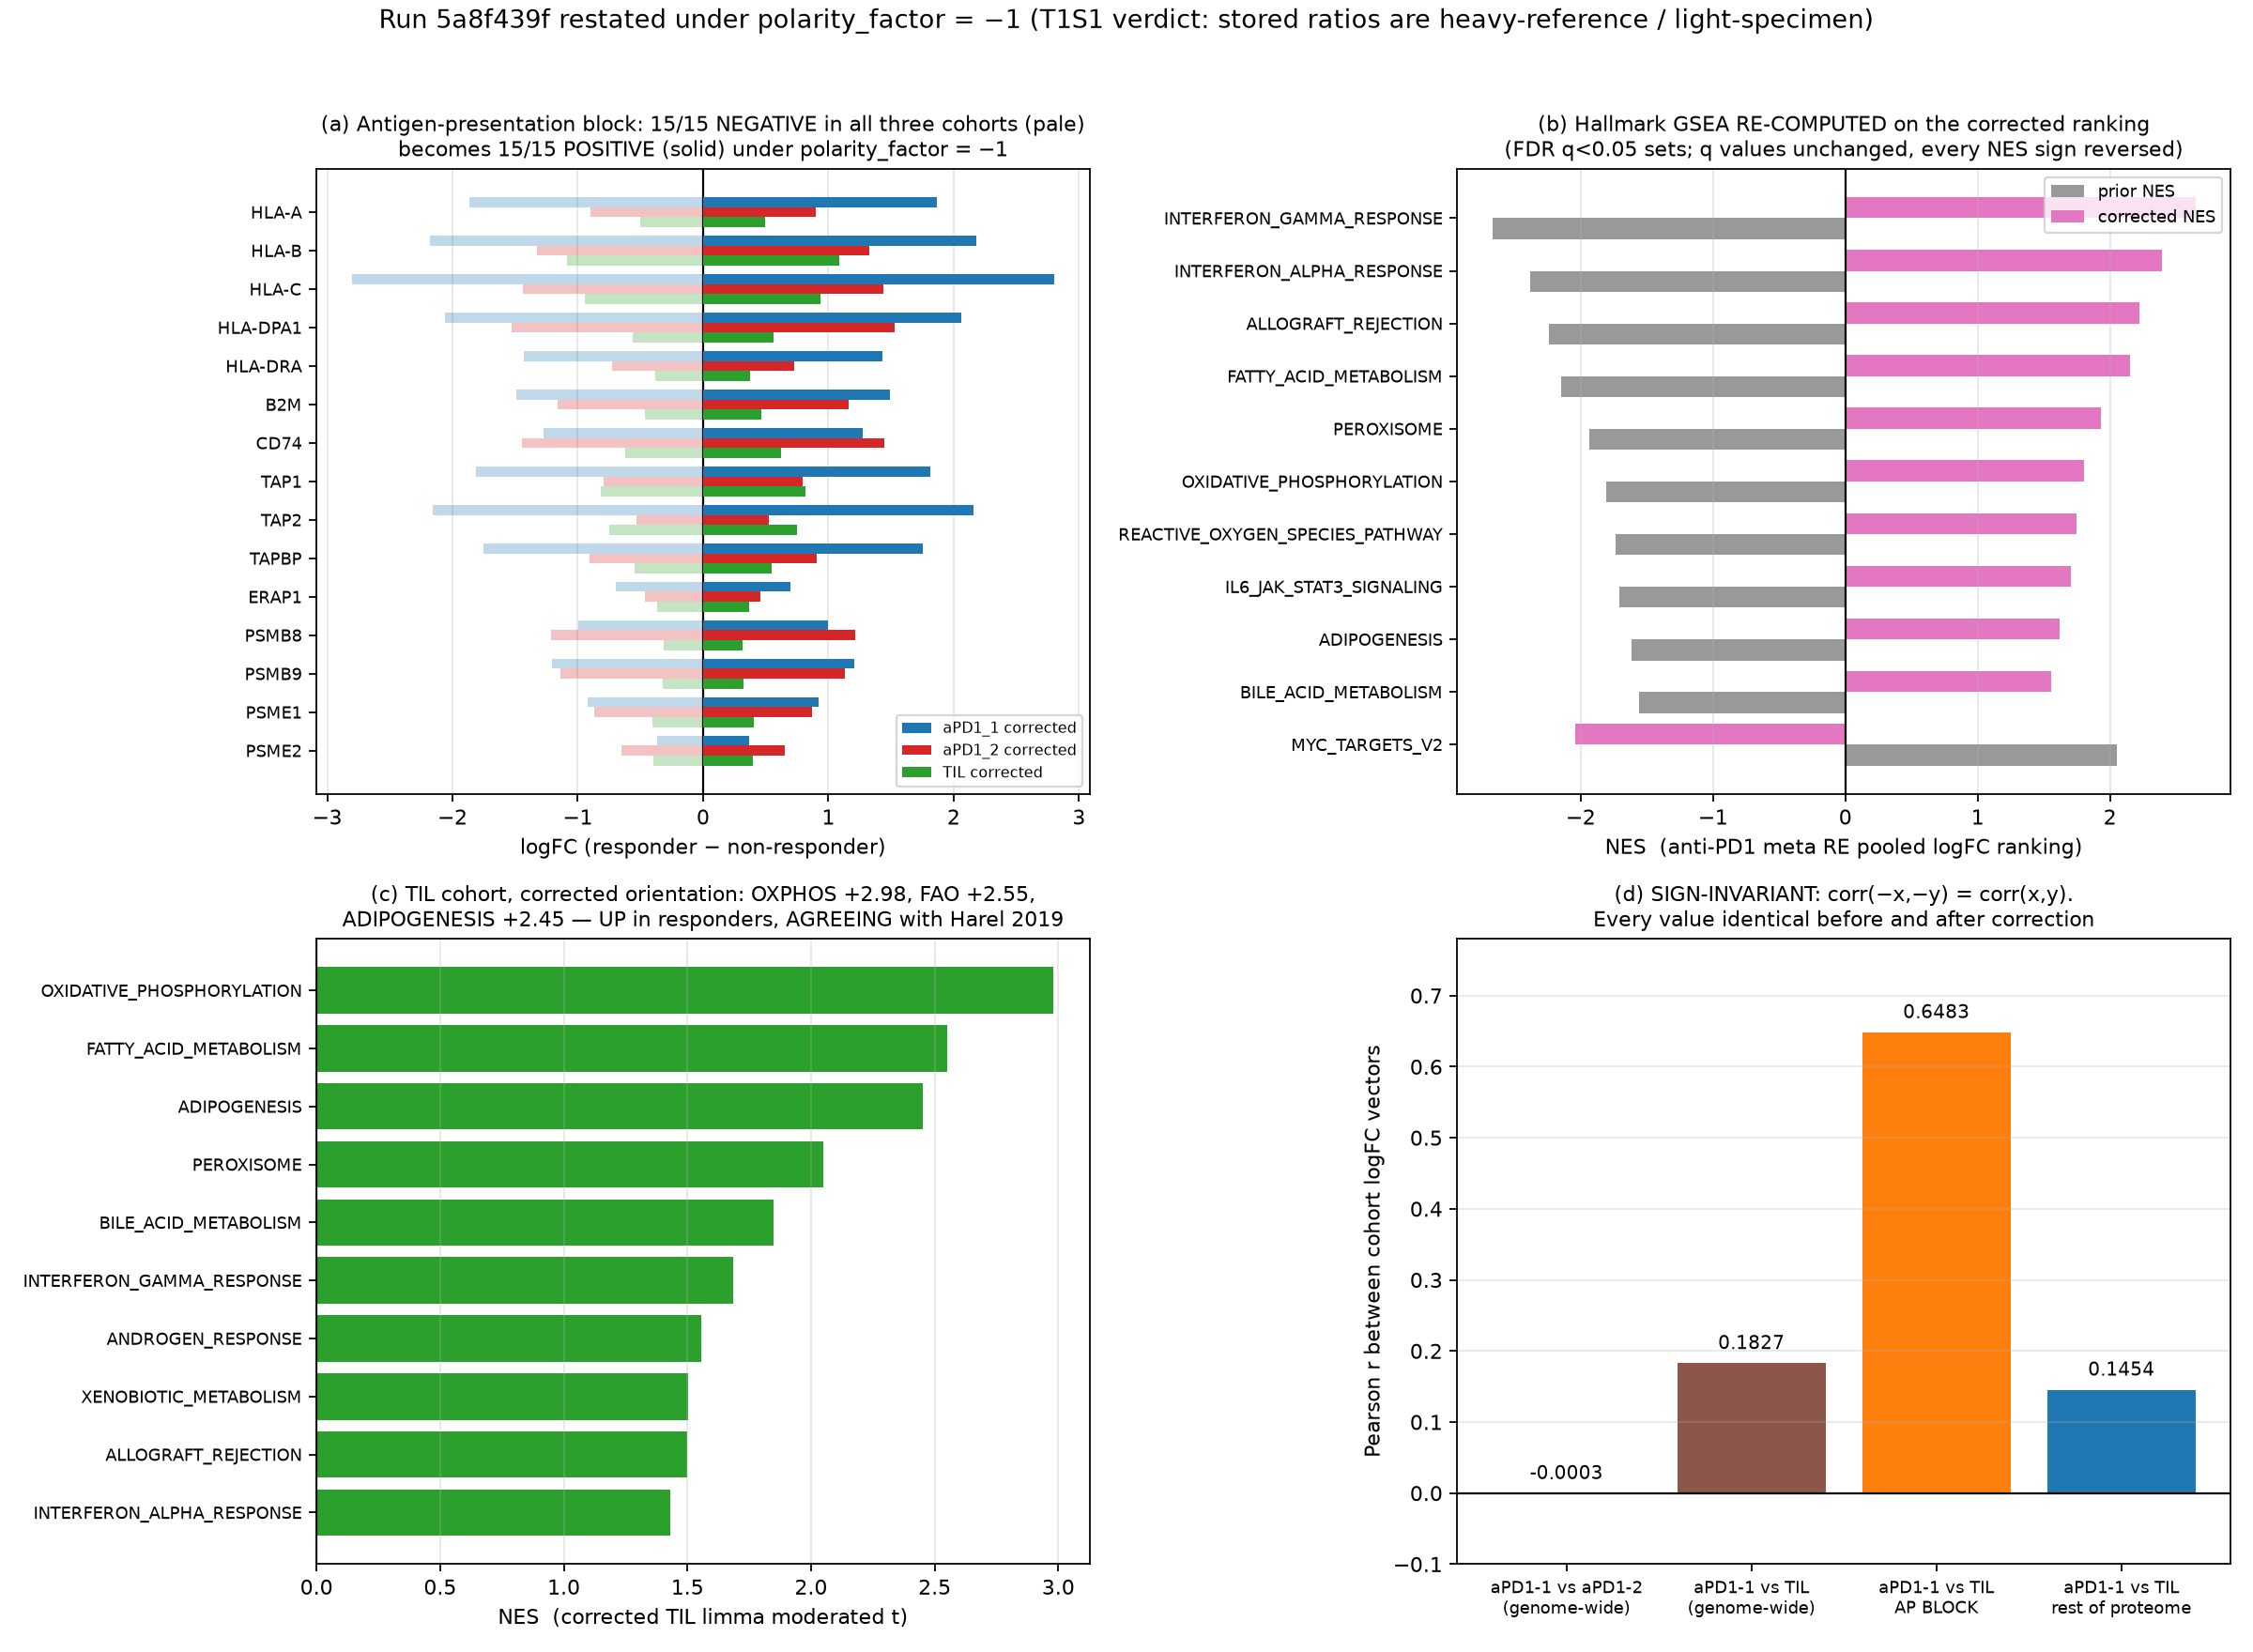
The partition is worth more than the flips. Thirteen classes of quantity are recorded as invariant with the reason attached: two-sided p-values on a contrast whose magnitude did not change, every FDR, the null-proportion estimates, the zero counts at FDR 0.10, all cross-cohort correlations, the sign-agreement fractions, standard errors and heterogeneity statistics, the Cox Wald p-values and permutation nulls, the response-stratified circularity result, and every enrichment p and q value.
Three ledger rows dissolve instead of flipping, because they were never directional claims: the zero proteins at FDR 0.10, the zero hits in the survival scan, and the circularity collapse from 22 to 1. No null result on this page is described as having flipped.
The partition also says what happens if the polarity verdict is itself overturned. The flipped rows revert, and nothing else moves. A reader who thinks the verdict is wrong can check that claim without rerunning anything. Being checkable beats being right.
One row matters more than the others: the comparison with the source publication. The first pass reported that these specimens inverted Harel 2019's mitochondrial model. Corrected, they reproduce it. Oxidative phosphorylation and lipid metabolism are higher in responders in both treatment arms, which is what the original analysis of these same specimens said.
Call that a positive control on the pipeline and stop there. Agreeing with the original analysis of the same data restores internal coherence; it validates nothing externally. The independent literature also makes uncomfortable reading. Patient-derived melanoma lines with deranged oxidative metabolism progress on anti-PD1, checkpoint-resistant models acquire a hypermetabolic phenotype, and a high-oxidative CD8 T-cell state predicts resistance. Steady-state protein abundance in bulk tissue, oxygen consumption rate in derived lines, and intratumoral hypoxia are three different measurements. This analysis has the first one only, so the disagreement stays on the page instead of being talked away.
8. The score that failed its own positive control
The second objection needs a per-specimen estimate of how much immune and stromal tissue each biopsy contained. Three separate scores were built from marker panels, kept as three numbers rather than merged into one purity figure, and computed within cohort because the underlying searches are not comparable.
Internally the score looks excellent. The immune panel is the most coherent of the three, with a first principal component carrying 42 to 47% of variance and mean pairwise correlations of 0.32 to 0.43, and it behaves that way in all three independent searches. A rank-based alternative agrees with it at Spearman 0.93 to 0.94. Drop any single member and the score still correlates with the full version at 0.98 or better, so no one high-variance protein is doing the work.
Then comes the control it was built to pass. Xenografts contain no human leukocytes, so a human immune score should place them low.
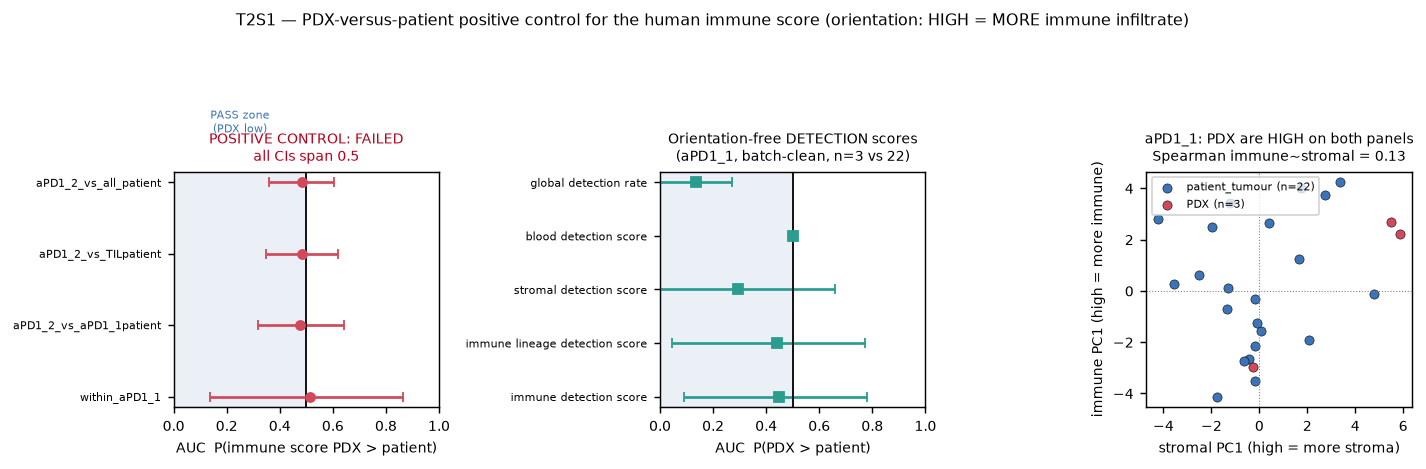
In the only contrast not confounded with search batch, the area under the curve is 0.5152 with a 95% interval of 0.136 to 0.864 and p = 0.969. The point estimate is on the wrong side of chance and the interval spans it. The three well-powered cross-cohort contrasts, at 33 against 63 specimens, land flat at 0.478 to 0.485.
The diagnosis teaches more than the failure does. Xenograft specimens score high on human immune, human stromal and human blood panels at once, at medians of +2.2, +5.5 and +2.0 against roughly zero for patient tumours. Per protein, the markers most elevated in xenografts are membrane and cytoskeletal proteins with well-conserved mouse orthologues, while the lineage-restricted and MHC class II-dependent members move the other way. A real human leukocyte signal would move them together. What this looks like is a human-only search database absorbing conserved mouse peptides into human protein groups, which is the problem species-aware xenograft proteomics pipelines exist to solve.
Three attempts to rescue the score all fail, and all three are reported. An orientation-free version using only whether a marker was detected returns 0.447. Residualising the immune score on a shared stromal and blood offset returns 0.424, even though that offset separates the xenografts strongly on its own at 0.939. One score in the file does place xenografts low, the global detection rate at 0.136, and all it says is that xenografts yield fewer identifications overall. Nothing immune-specific about it.
The score went forward anyway, flagged not validated, with the flag propagated into every downstream artifact. That was the right call, and it carries a permanent constraint on the language. For the rest of this analysis, saying an effect was attenuated by purity means it shares variance with an unvalidated proteome-internal axis. It never means tumour purity explains it.
The only batch-clean comparison has 3 xenografts against 22 patient tumours, which gives a confidence interval 0.73 wide. Even a correctly placed point estimate could not have demonstrated validity from that stratum.
The well-powered comparisons are all perfectly aliased with MaxQuant search batch, because the one cohort with plenty of xenografts is nothing but xenografts. This design cannot answer the question cleanly. Saying so out loud beats declaring the score valid on the grounds that nothing disproved it.
9. What each programme is entangled with
Find out whether the adjustment is identifiable before running it. Regress a variable on something it nearly is and you get a confident nothing back. Both programmes were summarised as eigengenes and correlated against the purity scores, with thresholds fixed in advance and applied the same way to each.
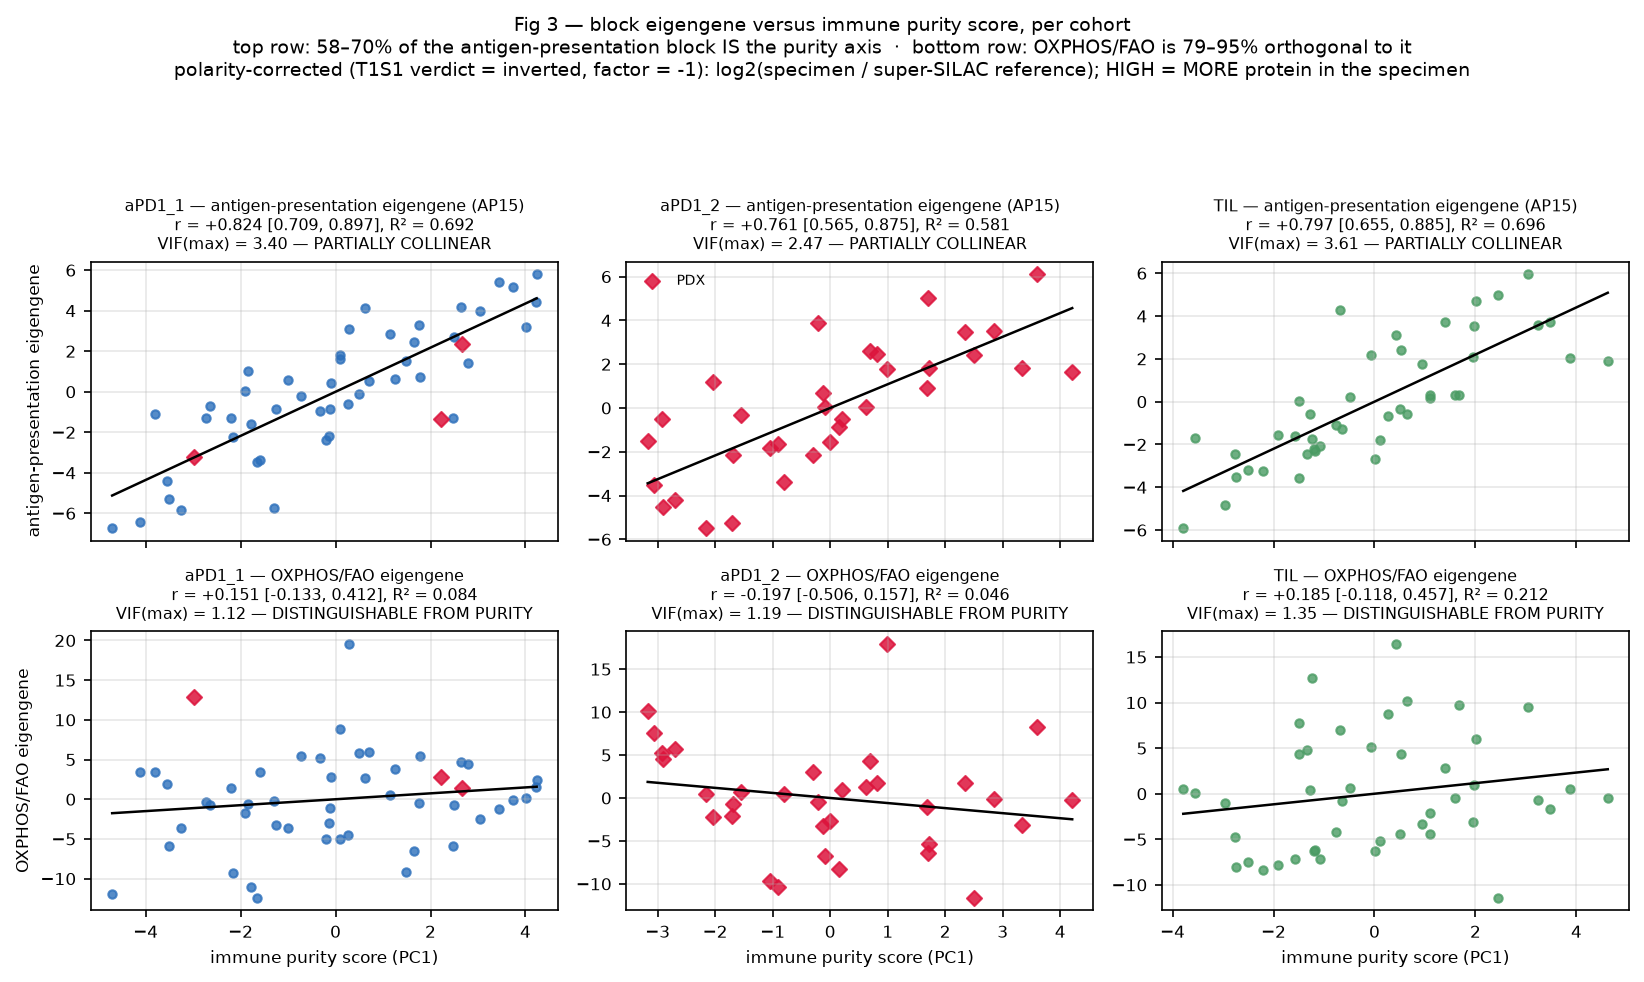
The antigen-presentation block correlates with the immune score at 0.824, 0.761 and 0.797, explaining 58 to 70% of its variance, with a maximum variance inflation factor of 3.6. The metabolic block correlates at 0.151, -0.197 and 0.185, with only one of its six intervals against the two purity scores excluding zero, and 79 to 95% of its variance unexplained by purity. The step's own brief had predicted that oxidative phosphorylation would be the complementary side of the purity axis. Its own data say otherwise, and it records that.
Two design choices keep those numbers from being circular. First, the eigengenes use the identical function that built the purity scores, and recomputing the purity scores that way reproduces the published ones at a correlation of 1.0 with a maximum absolute difference below 1e-15. The two quantities being correlated are genuinely commensurable.
Second, CD74 and HLA-DRA sit in both the antigen-presentation block and the immune scoring panel, so shared membership accounts for part of the correlation. Instead of disclaiming it, the step built both stripped variants. Take those two proteins out of both sides and the correlations fall to 0.737, 0.565 and 0.606, with every interval still excluding zero. The relationship costs 0.09 to 0.20 in correlation and survives.
A background comparison makes the same point sharper. Against all quantified genes that belong to neither the block nor the scoring panel, the antigen-presentation block's median member sits at the 99.5th to 99.9th percentile of the background distribution of correlation with the immune score, and in one cohort all 15 members individually clear the background 95th percentile. The metabolic block sits between the 44th and 73rd percentile. Unremarkable.
What that means for the adjustment cuts both ways. No variance inflation factor anywhere reaches even the conventional threshold of 5, so the adjusted model is identifiable and a surviving coefficient means something. But the antigen-presentation block's standard error inflates 1.84 to 1.90 times at n = 21 and n = 41, while 58 to 70% of its variance goes away by construction, so you cannot tell its attenuation apart from lost power. Cannot separate is the honest phrase here; purity explains it is not. For the metabolic block, adjustment costs 1.06 to 1.16 times, close enough to free that any change there is real confounding.
10. What survives the adjustment
The same proteins, the same specimens, the same filter applied once, and three models that differ only in the design matrix. Set it up that way and a fold-change shift means the adjustment did something, not the filter.
At protein level nothing changes, because nothing was there. Zero proteins below FDR 0.10 before adjustment and zero after, in both estimable cohorts and in the survival scan. Every row of the output carries the framing that matters here: the adjustment did not remove the last of the signal, because no protein-level signal existed to remove.
At programme level the two families come apart cleanly, and that separation is the finding.
| Programme | r with immune score | Variance shared | SE cost | Under adjustment |
|---|---|---|---|---|
| Antigen presentation and interferon (15 proteins) | +0.82 / +0.76 / +0.80 | 0.69 / 0.58 / 0.70 | 1.84x to 1.90x | Block attenuates 48% where the background protein attenuates 0%. Every interferon and antigen-presentation hallmark set is lost, in both estimable cohorts. |
| OXPHOS, fatty-acid metabolism, adipogenesis (177 proteins) | +0.15 / -0.20 / +0.19 | 0.08 / 0.05 / 0.21 | 1.06x to 1.16x | TIL keeps 5 of 5 sets at a median NES cost of 1.84%. aPD1-1 keeps 1 of 5. ACAT1 moves by 0.47%. |
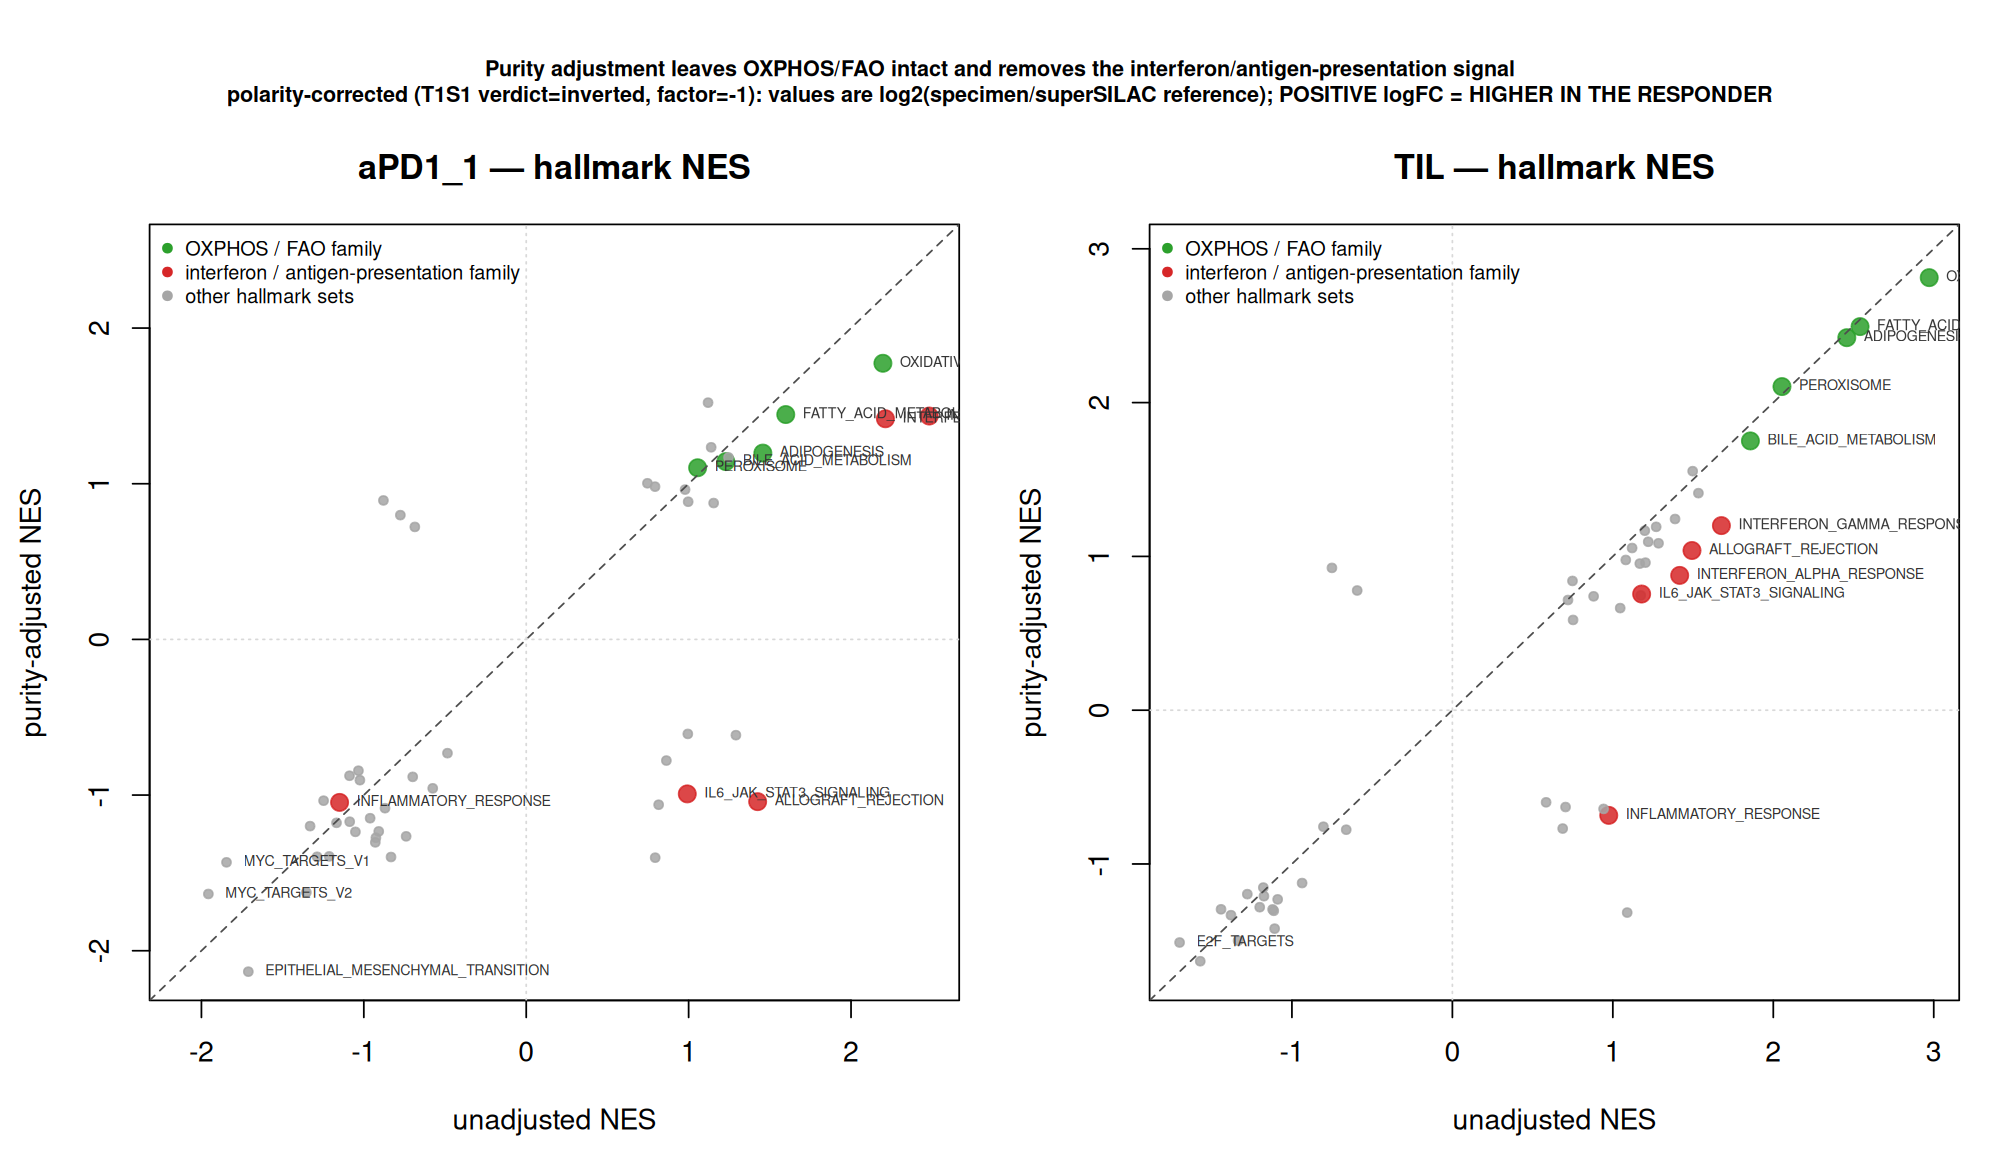
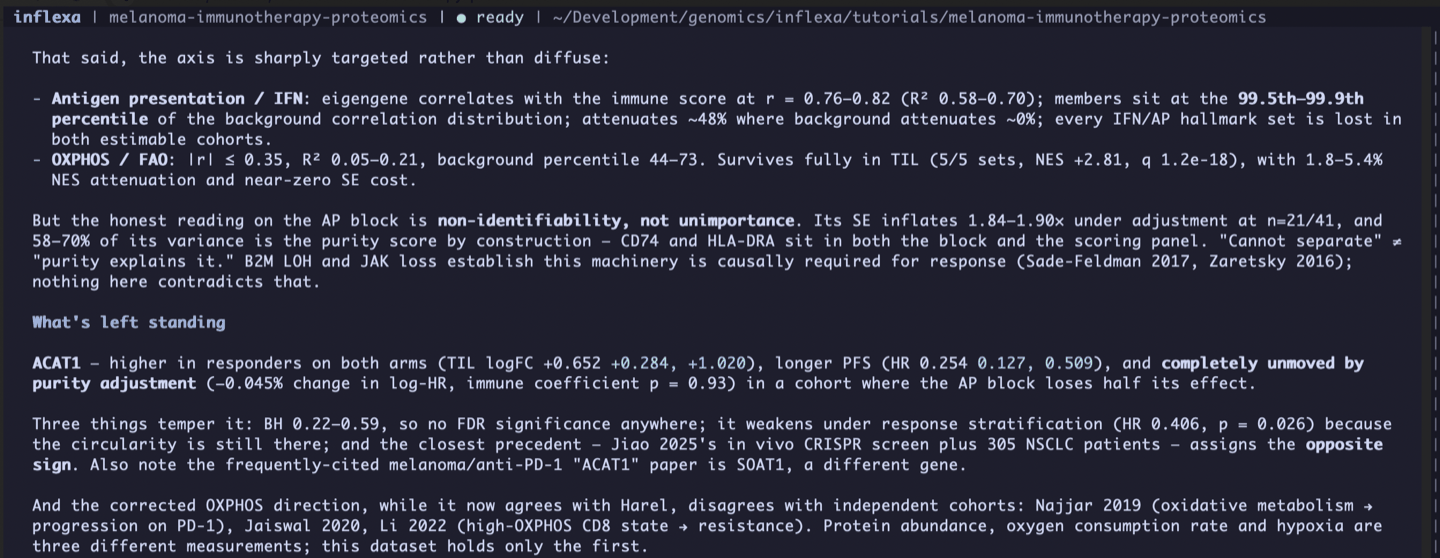
In TIL the metabolic family keeps 5 of 5 sets at a median enrichment cost of 1.84%, with oxidative phosphorylation still at an adjusted q of 1.2e-18. The interferon and antigen-presentation family keeps 0 of 5. In the anti-PD1 cohort the same asymmetry appears more weakly: metabolic keeps 1 of 5, interferon and antigen presentation keeps 0 of 5.
The adjustment is a scalpel, not a hammer, which is what makes the asymmetry readable. It barely moves the average protein, with an adjusted-on-unadjusted slope of 0.90 and 0.97, while stripping a median 48.6% and 47.7% off the antigen-presentation block against a background attenuation of -3.7% and -0.3%. The block's immune coefficient runs six to seven times the proteome median.
Inside that block, the two proteins that also belong to the scoring panel are the two most attenuated, at 88% and 76%. Circularity doing precisely what you would predict. It is flagged on each row; dropping those proteins would have made the problem invisible instead of fixing it.
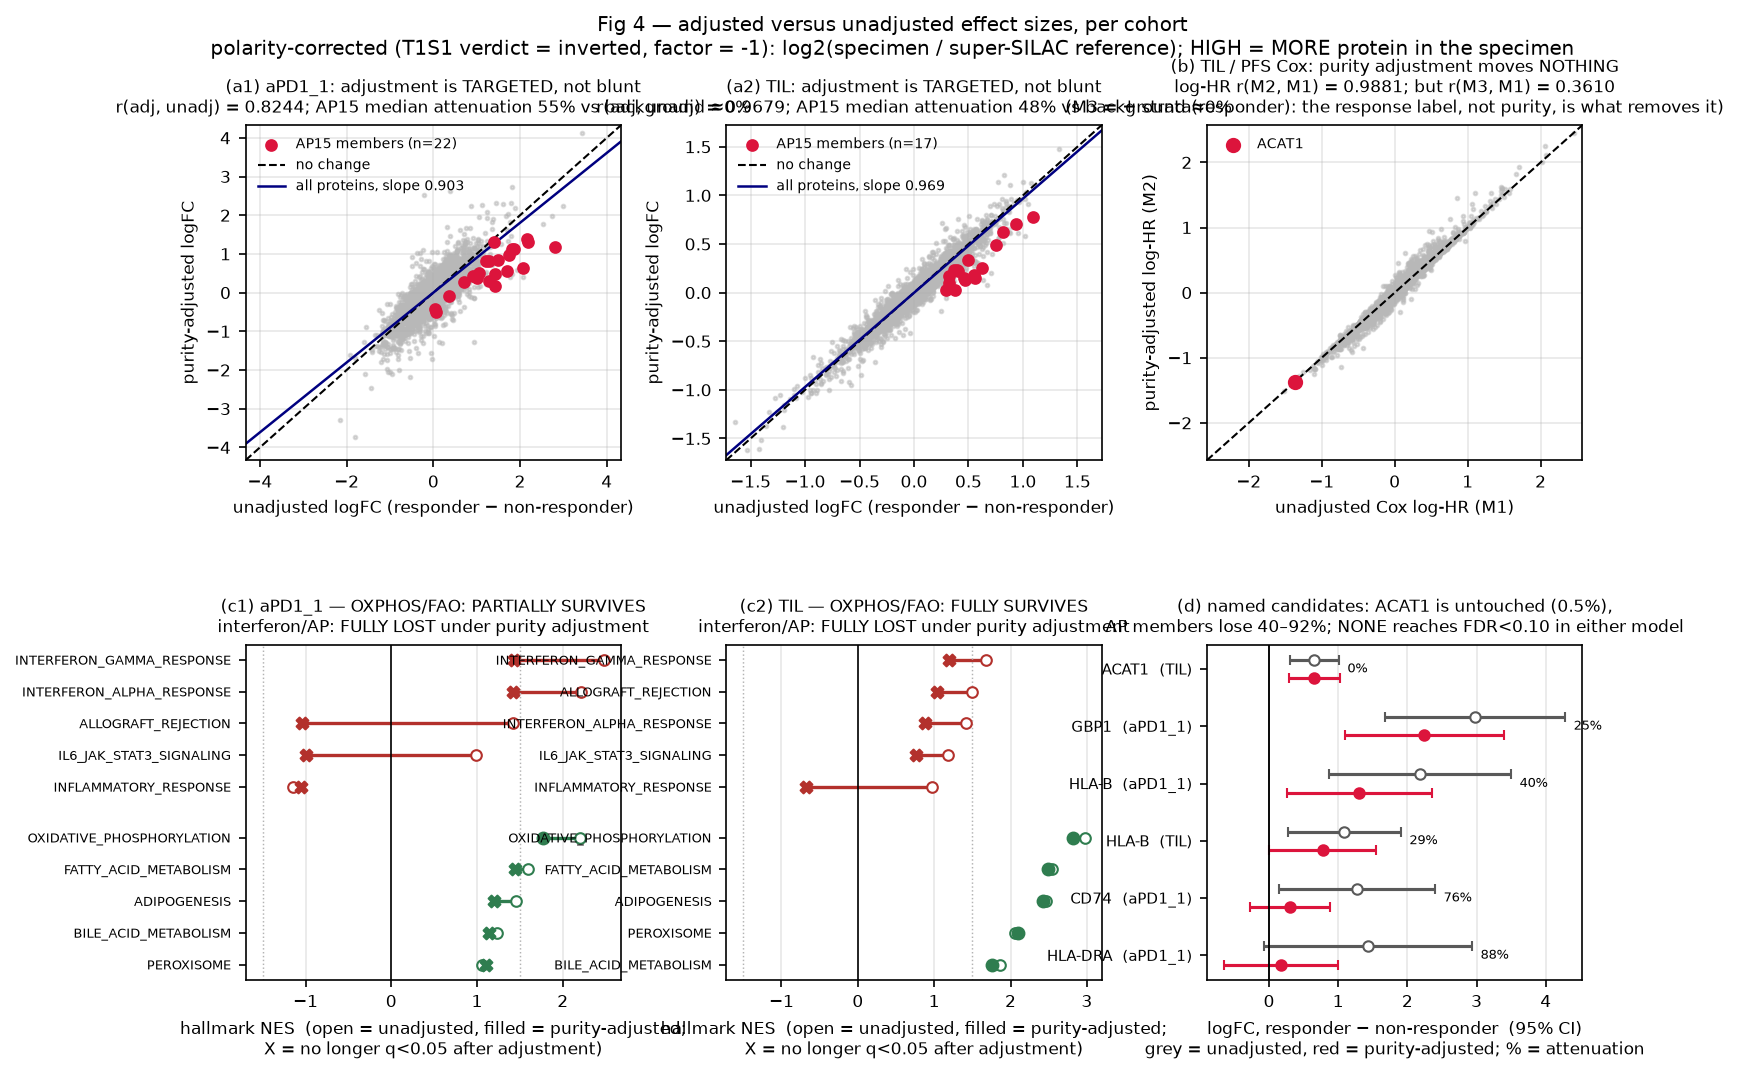
Two named proteins go opposite ways, and both are instructive. GBP1 ranks first in the anti-PD1 responder contrast at a corrected fold change of +2.98, then splits by cohort under adjustment: 24.7% attenuation in anti-PD1, 79.4% in TIL, where its adjusted p reaches 0.76. It never approaches FDR significance in either. The literature puts GBP1 mostly in macrophages, so an infiltrate read-out that fails to replicate across arms and collapses under a composition adjustment is doing what you would expect of it.
ACAT1 does the opposite. Its response contrast moves by 0.47%. Its immune coefficient is +0.0086 per standard deviation at p = 0.926. On the survival side its hazard ratio goes from 0.2541 to 0.2540 under adjustment, a change of 0.045% in the log hazard, and proteome-wide the adjusted and unadjusted log hazard ratios correlate at 0.988. The purity covariate carries no survival signal of its own, with a hazard ratio of 0.918 and p = 0.61.
Then comes the control that does bite. Stratify the same Cox model on the response label and the prior 25 candidates collapse from 22 to 1 at raw p below 0.05, and to 0 at every FDR threshold, while the proteome-wide correlation between stratified and unstratified log hazard ratios drops to 0.361. ACAT1 is the lone survivor at p = 0.026, with a focused FDR of 0.64 and a proteome-wide FDR of 0.89. Purity turns out to be nearly orthogonal to the protein effects. The response label is anything but.
Proportional hazards was checked across 92 diagnostic rows, and 10 violate at p below 0.05. All 10 are in the output. ACAT1's own protein term satisfies the assumption in every model, and the violation in its adjusted fit sits on the purity covariate. B2M and HLA-DPA1 violate on the protein term itself, so their single-number hazard ratios are not valid constant-hazard summaries and nobody should read them as such. Both are non-significant anyway.
The verdict
This deposition contains no protein-level biomarker. Nothing reaches FDR 0.10 in any cohort, on either arm, in any model, before or after any correction on this page. The first pass found that and so did the second, and no amount of reorientation could have moved it.
Direction is what changed. The stored ratios were inverted; the run showed it empirically with two panels whose expected signs oppose each other, checked it against the column definition, and applied the fix as a typed transformation with a ledger. The first pass's most quotable claim, that these data invert the source publication's mitochondrial model, was the artefact all along. Corrected, they reproduce it.
The purity audit then splits what is left. The antigen-presentation and interferon programme is 58 to 70% the composition axis, sits at the 99.5th percentile of the proteome background for correlation with it, loses every hallmark set under an adjustment that costs the average protein nothing, and behaves impossibly in an all-xenograft cohort under both orientations. Call that non-identifiability. It is not a claim that the machinery is unimportant. B2M and JAK loss-of-function, HLA loss of heterozygosity and immunoproteasome expression all show this machinery is causally required for checkpoint response, and nothing here touches that. Bulk super-SILAC proteomes at 21 and 41 specimens simply cannot separate it from infiltrate.
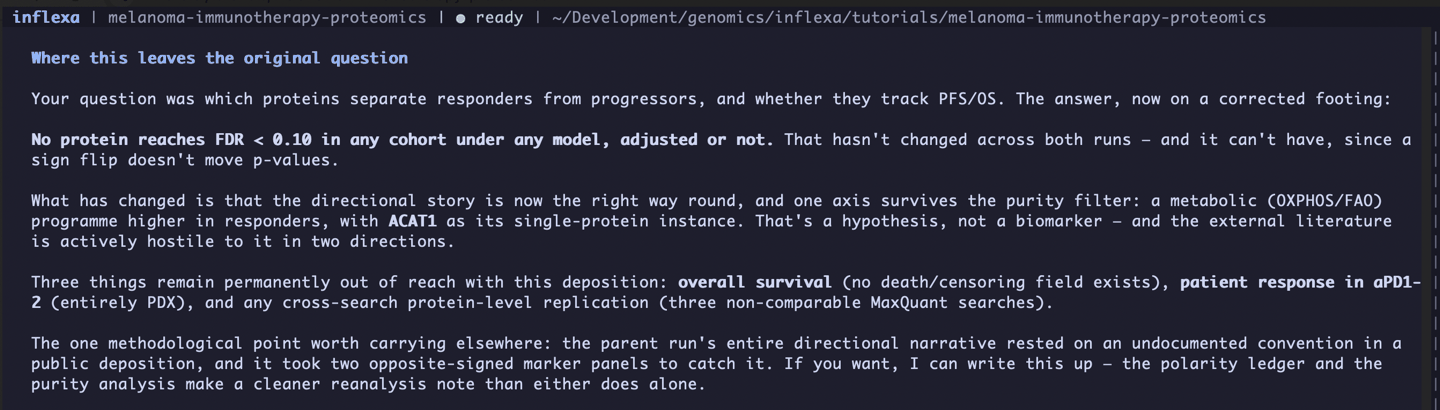
One programme is left standing, and only as a hypothesis: oxidative phosphorylation, fatty-acid metabolism and adipogenesis, higher in responders, orthogonal to the composition axis, surviving adjustment at a standard-error cost near zero. ACAT1 is its single-protein instance, concordant across two different treatment modalities and untouched by adjustment. It is still not a biomarker. It fails multiplicity correction on both arms, it weakens under response stratification, its survival endpoint was derived and never observed, and the closest external precedent gives it the opposite sign in a different tumour type.
The run's own reading of its null belongs next to all of that. In the anti-PD1 cohort, a protein would need an effect of about 3.7-fold to show up at rank one of 5,473 tests, which is 7.7 times the median observed effect, and only 28 proteins reach that magnitude at all. The artifact calls that null weak evidence of absence and refuses to dress it up as an informative negative.
If you run this yourself, here are the numbers to compare against. Report FDR-significant response biomarkers from these cohorts and something has gone wrong. Report a direction without testing which way the ratio points and you have put a coin flip in your paper. Report the interferon signal as response biology with no composition control and what you have measured is how much immune tissue was in each biopsy.
What is still open
Four questions the analysis names and cannot settle from these files. Anyone taking this further starts here:
- The purity covariate needs to be a real measurement. It is computed from the same ratio matrix as the proteins it adjusts, and it failed its only external check. Histological purity, or an orthogonally quantified leukocyte estimate, would turn every shared-with-purity statement on this page into an explained-by-purity statement or refute it.
- The deposition contains its own knockout experiment, and this analysis never opened it. Two of the five protein-group tables are cell-line follow-up, and one is 39 columns of CRISPR knockouts in the WM266 line whose columns are named for ACAT1, CPT1A, FABP7, HADHA and HMGCL against six controls. The one candidate left standing here is ACAT1. Its knockout proteome sits in the same download. It fell outside the scope of a patient-cohort re-analysis, which makes it the obvious next thing to open.
- The three searches cannot be integrated as deposited. Protein groups are not comparable across MaxQuant runs, and the purity scores are cohort-internal principal components, so the two cohorts never received the same adjustment. Nowhere in this analysis is there cross-cohort protein-level replication. A single joint search over the raw files would fix that, and it is a reprocessing job, not a re-analysis.
- The direction still has to be squared with the independent literature. Recovering the source publication's direction means agreeing with the original analysis of the same specimens, which validates nothing externally, and independent cohorts mostly point the other way on tumour oxidative metabolism. Settling it needs an endpoint this deposition does not have: a real event field, plus a measurement that tells tumour-cell oxidative content apart from T-cell.
None of the four were run. Both runs stopped where the evidence stopped, which is also why the write-up can be so specific about what it does not know.
The full report, and the data package
This page is the walkthrough. The report and the data package carry the rest, so you never have to take the write-up on trust. That matters more here than on most tutorials, because the interesting claim on this page is that an earlier version of the same analysis got it wrong.
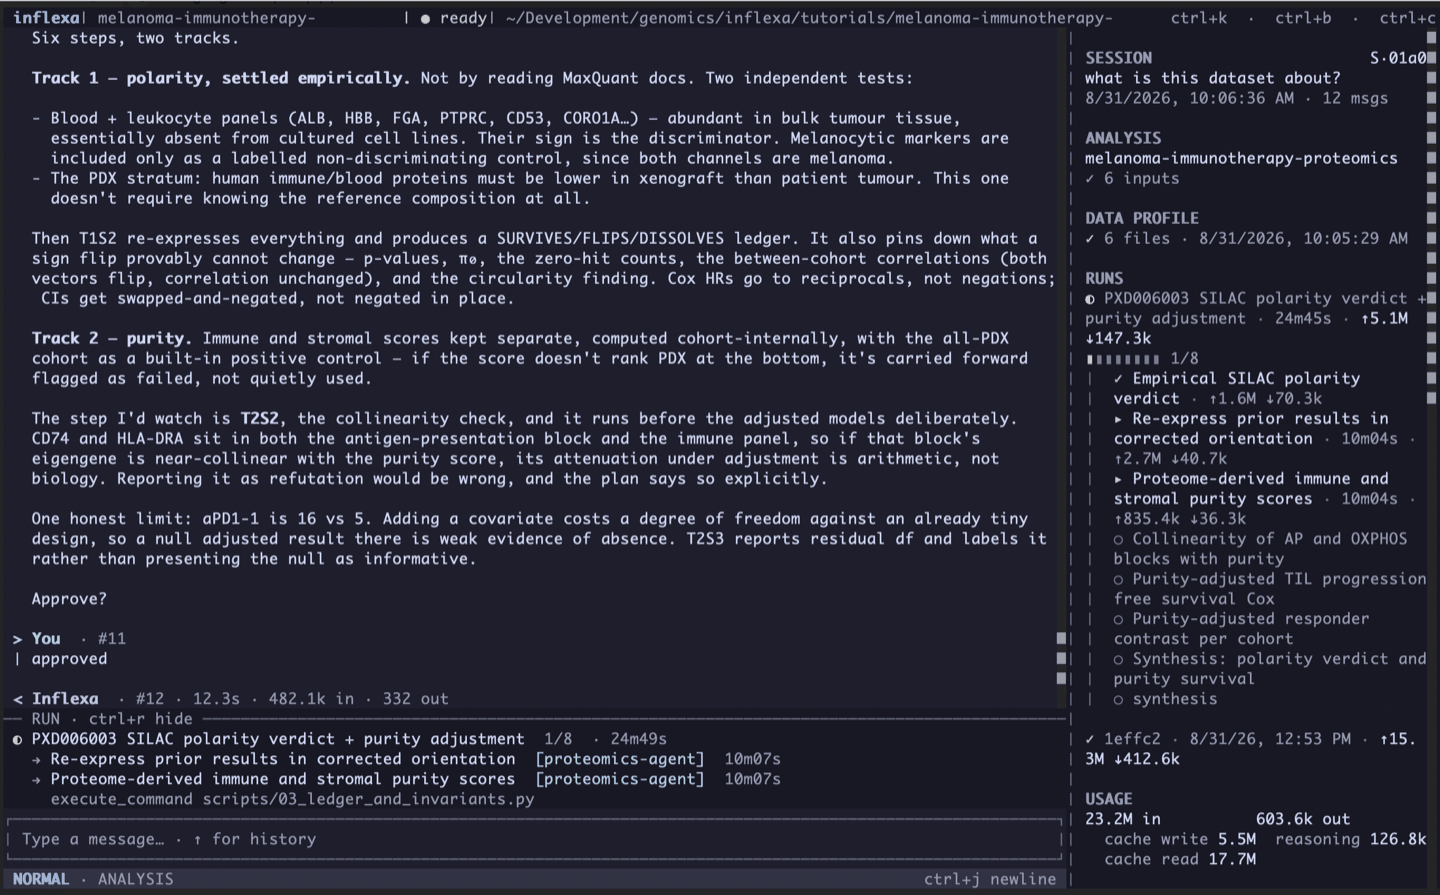
None of that depends on the write-up existing. It is how the analysis directory is laid out while the work is happening, and the right rail below is the whole of it: the session and its first message, the analysis with its six registered inputs, the data profile stamped with the minute it was built, and both runs with every step, its wall time and its token counts.
The generated report
"No Protein-Level Response Biomarker in PXD006003, and Why the First Pass Answered Backwards". Every figure, every table with its data downloadable, the methods as executed, the flips and survives ledger in full, and the caveats stated where they apply rather than gathered at the end. It is the document this page was written from.
The report ships as a self-contained HTML file inside the package below. Open it in a browser after downloading.
The data package
Both runs: the scripts as they were generated and executed, every output table including the empty short list with its full schema, the polarity verdict, the transformation ledger, and the validation checks. Enough to reproduce either run without this page, or to check any number on it.
10.5281/zenodo.22211981Your turn
Forget the accession. What travels is the pair of questions the first run asked about itself, and both fit in a single prompt:
Before I believe any direction in this: test which way round the ratio is stored, using markers whose expected sign you can defend, and use at least two panels whose expected signs are opposite. Then estimate specimen composition from the data itself and tell me which of these results is still there after adjusting for it.
Three habits from these runs carry over to any dataset.
Test the sign; do not read it off a comment. An orientation you took on trust is a coin flip that propagates into every fold change, every hazard ratio and every enrichment direction downstream, and it is the one error that yields a perfectly coherent wrong answer. Two panels with opposite expected signs cost almost nothing, and no centring artefact can satisfy both at once.
Build the control that could falsify your covariate, and publish the result when it fails. The purity score here is beautiful on the inside and did not do what it claimed. Saying so made the analysis more useful than a clean adjustment nobody could check.
Work out what a correction can touch and what it cannot before you apply it. The ledger on this page has outlived the flips it records, because it tells a reader who doubts the verdict which rows would revert and which would stay put.
Run this on your own data.
Inflexa is free and open source under Apache 2.0. It runs on your machine, with the model you choose, and every result carries a record of how it was made.