What is IFN-β doing to PBMCs, cell type by cell type?
A complete Inflexa session on GSE96583: 24,562 cells collapsed into 108 donor-paired pseudobulk libraries, a lineage ranking on a scale that cell number cannot inflate, and a formal interaction test that decides what is shared instead of guessing from overlap.
GSE96583 (Kang et al. 2018, PMID 29227470). PBMCs from eight lupus donors, pooled and split into a control lane and a lane stimulated with IFN-β for six hours, with each cell assigned back to its donor by demuxlet. 9 files, 74.4 MB. This tutorial uses capture batch 2 (GSM2560248 and GSM2560249), which yields 24,562 QC-passing singlets across seven testable lineages. GEO accession
This is the standard teaching dataset for single-cell differential expression, and it is standard for a good reason: the design is genuinely paired. The same eight people appear in both arms, because their cells were pooled before they were split, so donor is a blocking factor rather than a hope. Very few public single-cell experiments give you that.
It is also the dataset where the most common single-cell mistake is most tempting. There are 24,562 cells and eight donors. Treating cells as replicates buys you spectacular p-values from an experiment whose real sample size is eight. What happens to that temptation, without anyone naming it in the prompt, is the first thing worth watching on this page.
Everything below is one session. The prompts are quoted exactly as they were typed, the screenshots are from the run that produced the figures, and the run identifier is the same one printed in the terminal: 7a82f521.
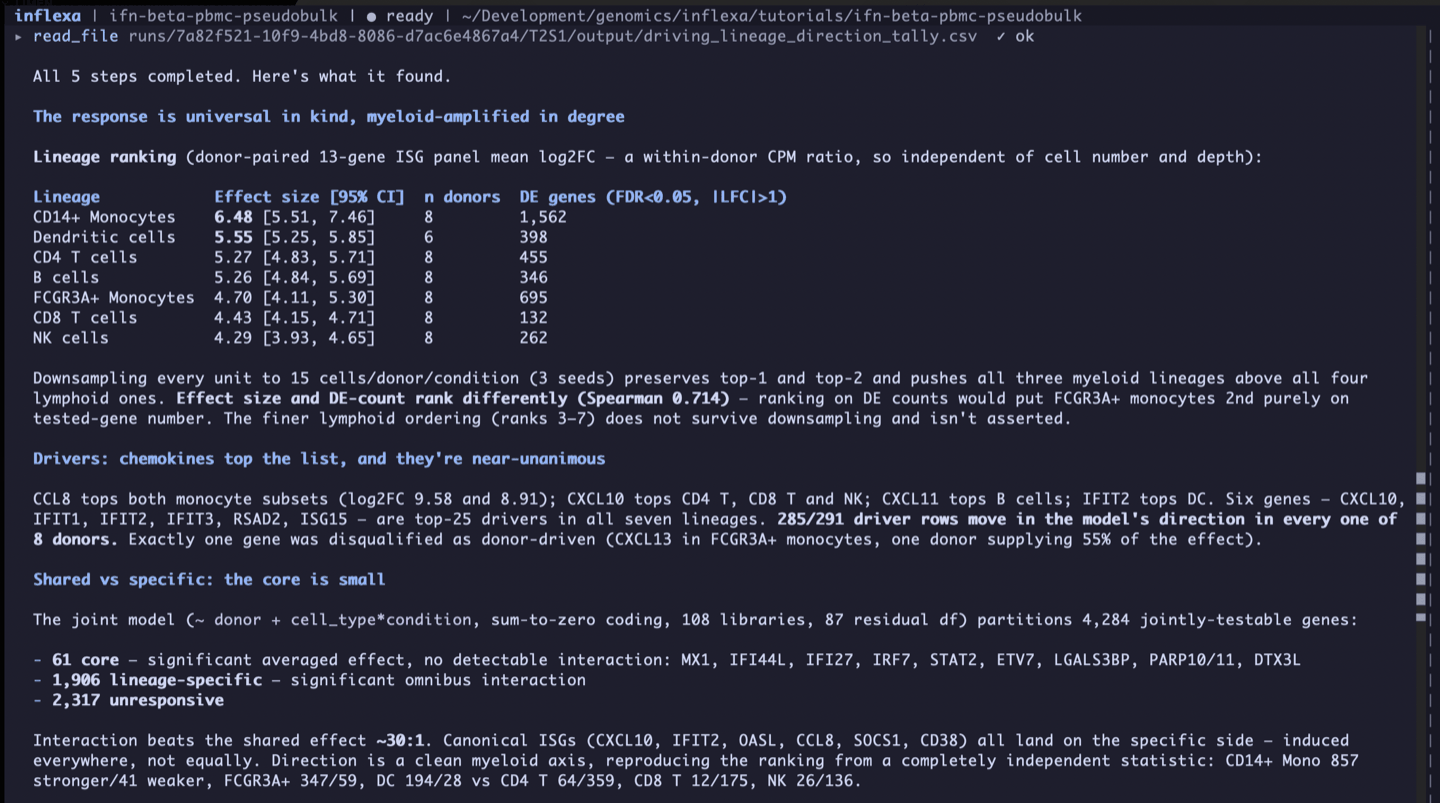
- Universal in kind, myeloid-amplified in degree. All seven lineages induce the interferon module: 56 of 56 donor-lineage pairs positive, every confidence interval excluding zero. But on a within-donor effect size that cell number cannot inflate, CD14+ monocytes lead at 6.48 log2FC (95% CI [5.51, 7.46]) and dendritic cells follow at 5.55.
- The obvious scale is the wrong scale. Ranking lineages by DE-gene count would put FCGR3A+ monocytes second on tested-gene number alone. Count and effect size correlate at only Spearman 0.714.
- The shared core is tiny. A joint model with a cell-type × condition interaction partitions 4,284 jointly testable genes into 61 core and 1,906 lineage-specific. Canonical ISGs like CXCL10, IFIT2, OASL, CCL8, SOCS1 and CD38 all land on the specific side, induced everywhere but not equally.
- What separates the lineages is not interferon. The interferon hallmark sets score almost identically everywhere (NES range 0.40). MYC targets and oxidative phosphorylation carry roughly 3.0 NES units of spread. The cost of the response individuates the lineages, not its content.
- One gene was promoted, and labelled a hypothesis anyway. SSB, the La lupus autoantigen, is the sharpest split in the data. It goes up 2.3 to 3.3 log2 units in all three myeloid lineages and stays flat or fractionally negative in CD4 T, CD8 T and NK cells. The run reports it as a mechanistic hypothesis, not a result.
- A second scoring method disagreed, and the run diagnosed it rather than picking a winner. singscore reorders the lineages; GSVA on the identical matrix and gene set does not. The cause is a bounded-scale ceiling, demonstrated rather than asserted.
The dataset, and what is awkward about it
Kang and colleagues pooled PBMCs from eight lupus patients, split the pool into a control lane and a lane treated with IFN-β for six hours, sequenced both, and used genotype-based demultiplexing to put every cell back with the donor it came from. The result is a stimulation experiment in which the same eight people are their own controls, at single-cell resolution, in a public file.
Six things about it are inconvenient, and every one of them changes a method choice downstream:
- Cells are not replicates. 24,562 cells, eight donors. Every test on this page has a denominator of 8, or 6 where dendritic cells are concerned, no matter how many cells went into it.
- The metadata table is quietly corrupt. It is an rbind of the two arms with R's
make.unique()applied to rownames, so 313 stimulated barcodes that collide with a control barcode were written with a-11suffix instead of-1. Join without reversing that and 313 cells silently fail to match the matrix. - The mitochondrial filter everyone runs cannot work here. All 13
MT-genes carry zero counts across every cell, because chrM was excluded upstream. More on this below, because the run caught it and said so. - The lineages are wildly different sizes. CD4 T cells contribute 10,373 cells and dendritic cells 432. Inside CD8 T cells, individual donor-arm units range from 15 cells to 536. Any ranking built on how many genes reach significance is measuring cell number.
- Depth is modest. Median 1,246 UMIs and 519 genes per cell. This is early-generation 10x data, which is exactly why pseudobulk aggregation is the right move rather than a conservative one.
- The labels are inherited and the donors are anonymous. Cell-type assignments come from the authors' own clustering and were not re-validated. No age, sex, disease activity, autoantibody status or treatment ships with the data, so the lupus background is context, not a modelled variable.
Before you start
This tutorial assumes Inflexa is installed, the sandbox is provisioned, and a model is configured. If any of that is not true yet, the getting started guide takes about fifteen minutes, most of which is the images and the packages downloading in the background.
Requirements beyond that are modest: Docker or Podman running, and room for a 74.4 MB download plus the run's own outputs, the largest of which is the 24,562-cell object. No GPU and no cluster.
Budget time rather than hardware. This run took 2 hours 6 minutes end to end, and the CLI says why before it starts: the first step untars the raw matrices and builds a 29,000-cell object. It detaches, so you can keep working while it goes.
Make a directory, and start Inflexa in it:
mkdir ifn-beta-pbmc && cd ifn-beta-pbmc && inflexaEverything after this happens inside the terminal interface. No file was downloaded by hand and no script was written by hand.
1. Get the data in
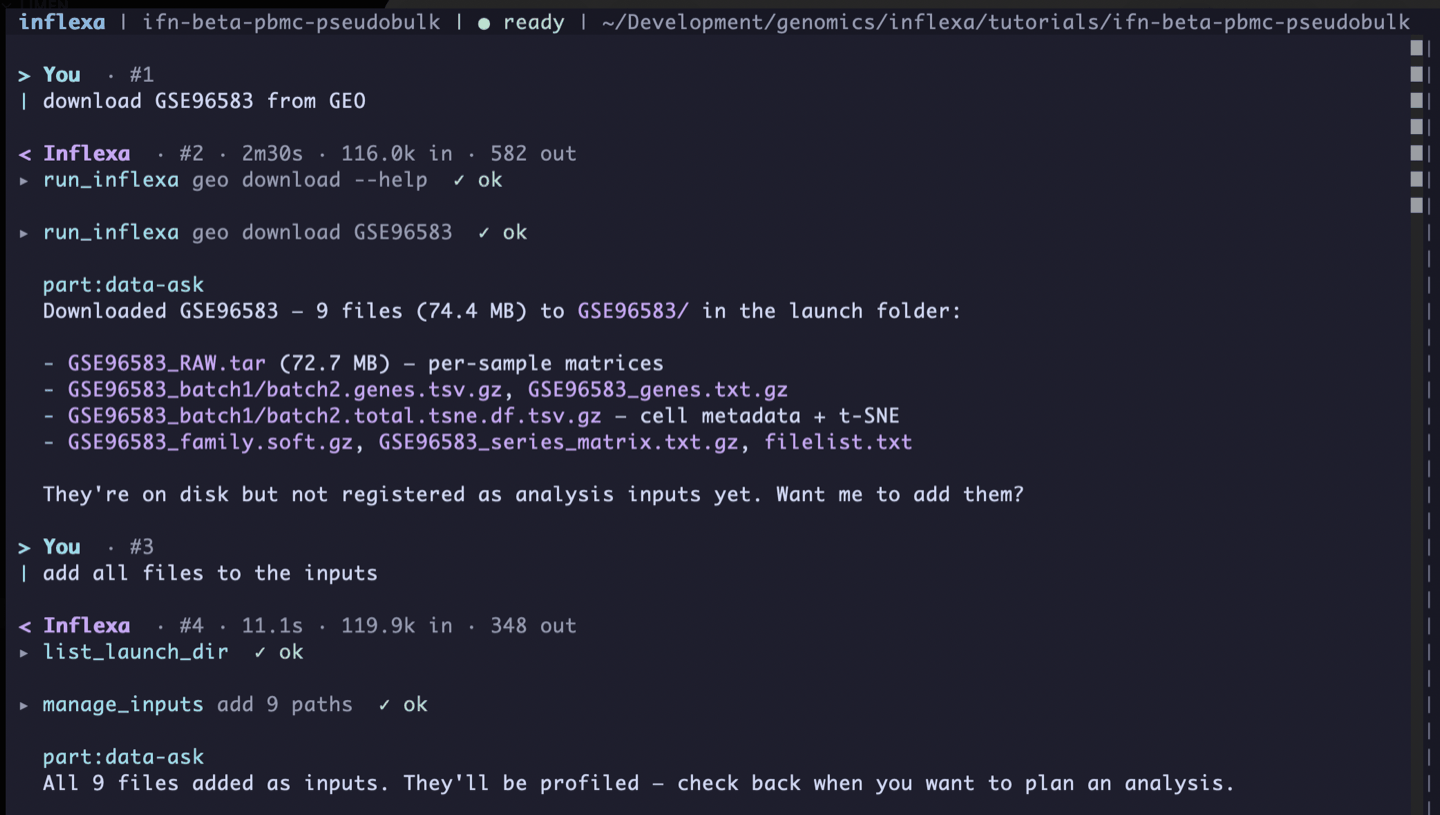
You do not need the FTP path or the file list. Name the accession and let the agent resolve it.
download GSE96583 from GEO
Two and a half minutes later, nine files and 74.4 MB are on disk, itemised by what each one is: the 72.7 MB tar of per-sample matrices, the gene tables, and the per-batch cell metadata carrying the t-SNE coordinates and the author cell-type labels.
Note what it does not do. The files are downloaded but not registered, and it says so and asks. Registering is what makes an input visible to every later step and to the provenance record, so it is a decision, not a formality.
add all files to the inputs
Eleven seconds. All nine paths registered, and profiling starts in the background, so by the time you have a question about the design the answer already exists.
2. One prompt, and the plan it produced
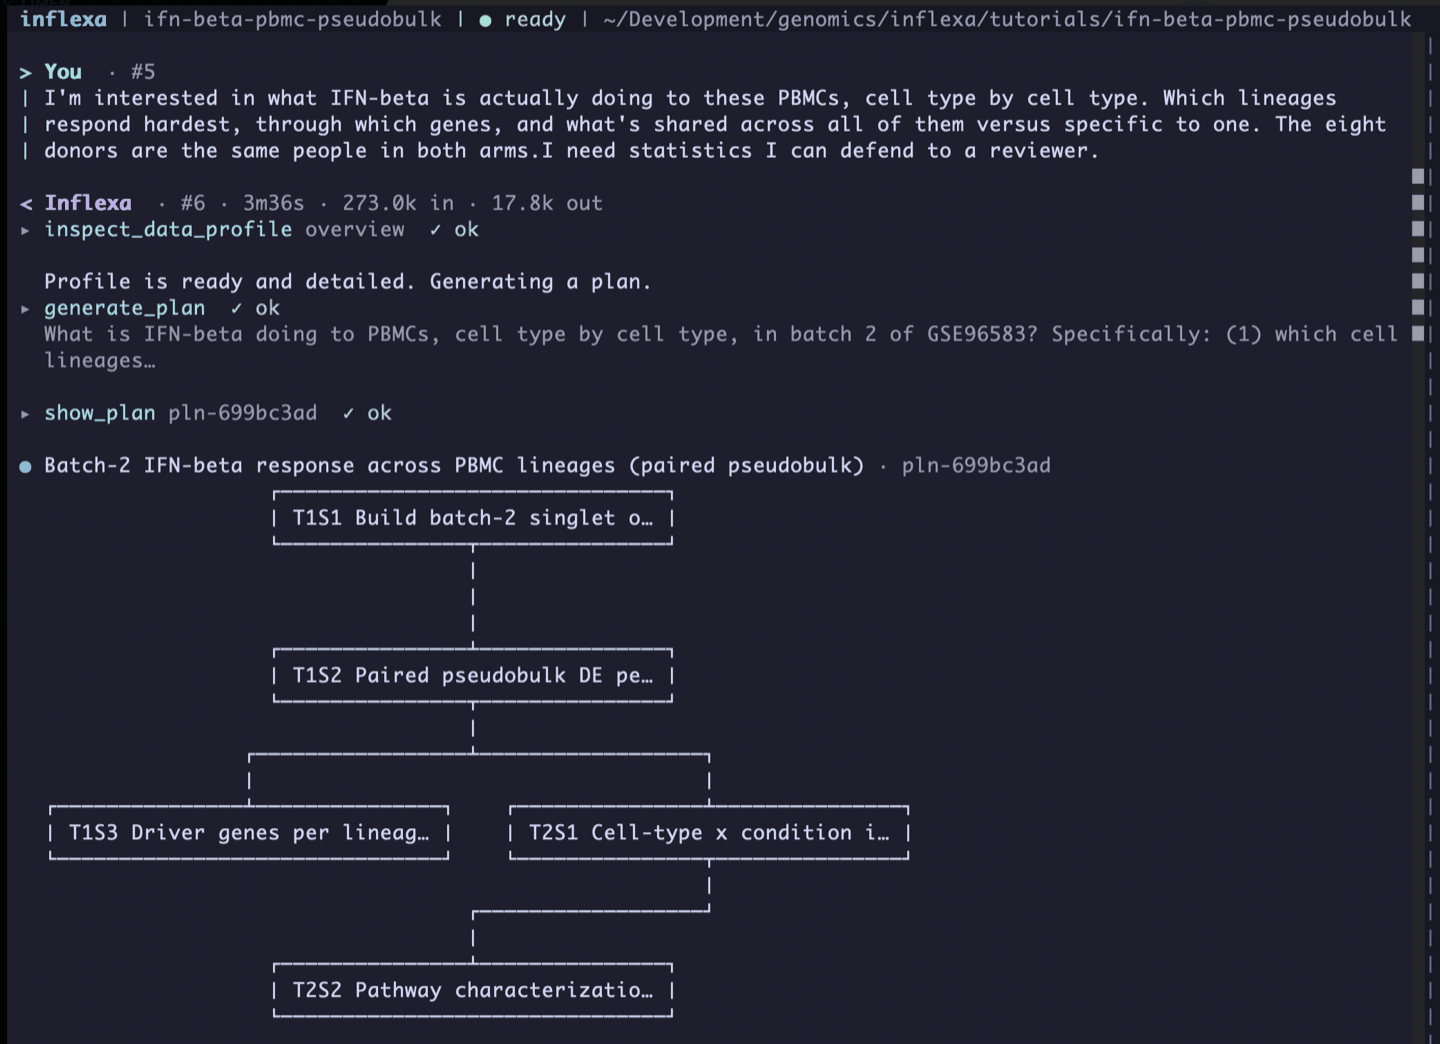
Here is the entire scientific request. It states a question, one fact about the design, and one standard. It names no method, no model, no software and no gene.
I'm interested in what IFN-beta is actually doing to these PBMCs, cell type by cell type. Which lineages respond hardest, through which genes, and what's shared across all of them versus specific to one. The eight donors are the same people in both arms. I need statistics I can defend to a reviewer.
The last sentence is the one that does the work. It sets a standard and leaves the method open. What comes back is a five-step plan on two tracks, generated from the data profile rather than from a template: build the batch-2 singlet object and the paired design table, run paired pseudobulk DE per lineage, then split into a driver-gene track and an interaction track that feeds the pathway step.
3. Three decisions nobody asked for
Before requesting approval, the plan states three design decisions and attributes them to the standard in the prompt. This is the most important screenshot on the page, because each one closes off a mistake that the data actively invites:
- No per-cell tests anywhere, because cells are not replicates. With 24,562 cells available, a per-cell Wilcoxon would have produced spectacular p-values from a sample size of eight people. Nothing in the prompt forbade it.
- Specificity comes from an interaction test, not from intersecting per-lineage significance calls. Taking the genes significant in all seven lineages and calling them "shared" conflates power with biology: a gene fails the intersection by being untested in one lineage. A cell-type × condition interaction asks the actual question, which is whether the coefficients differ.
- Lineage ranking is not DE-gene counts, because those scale with cell number and monocytes would win trivially. The prediction is stated before the ranking exists, which is what makes it a design decision rather than a defence.
A tool optimising for a good demo runs the per-cell test, reports thousands of significant genes at vanishing p-values, and ranks monocytes first for the wrong reason. All three of those would have produced the same headline as the run actually produced. That is precisely why deciding them in the open, before execution, is the interesting output of this step.
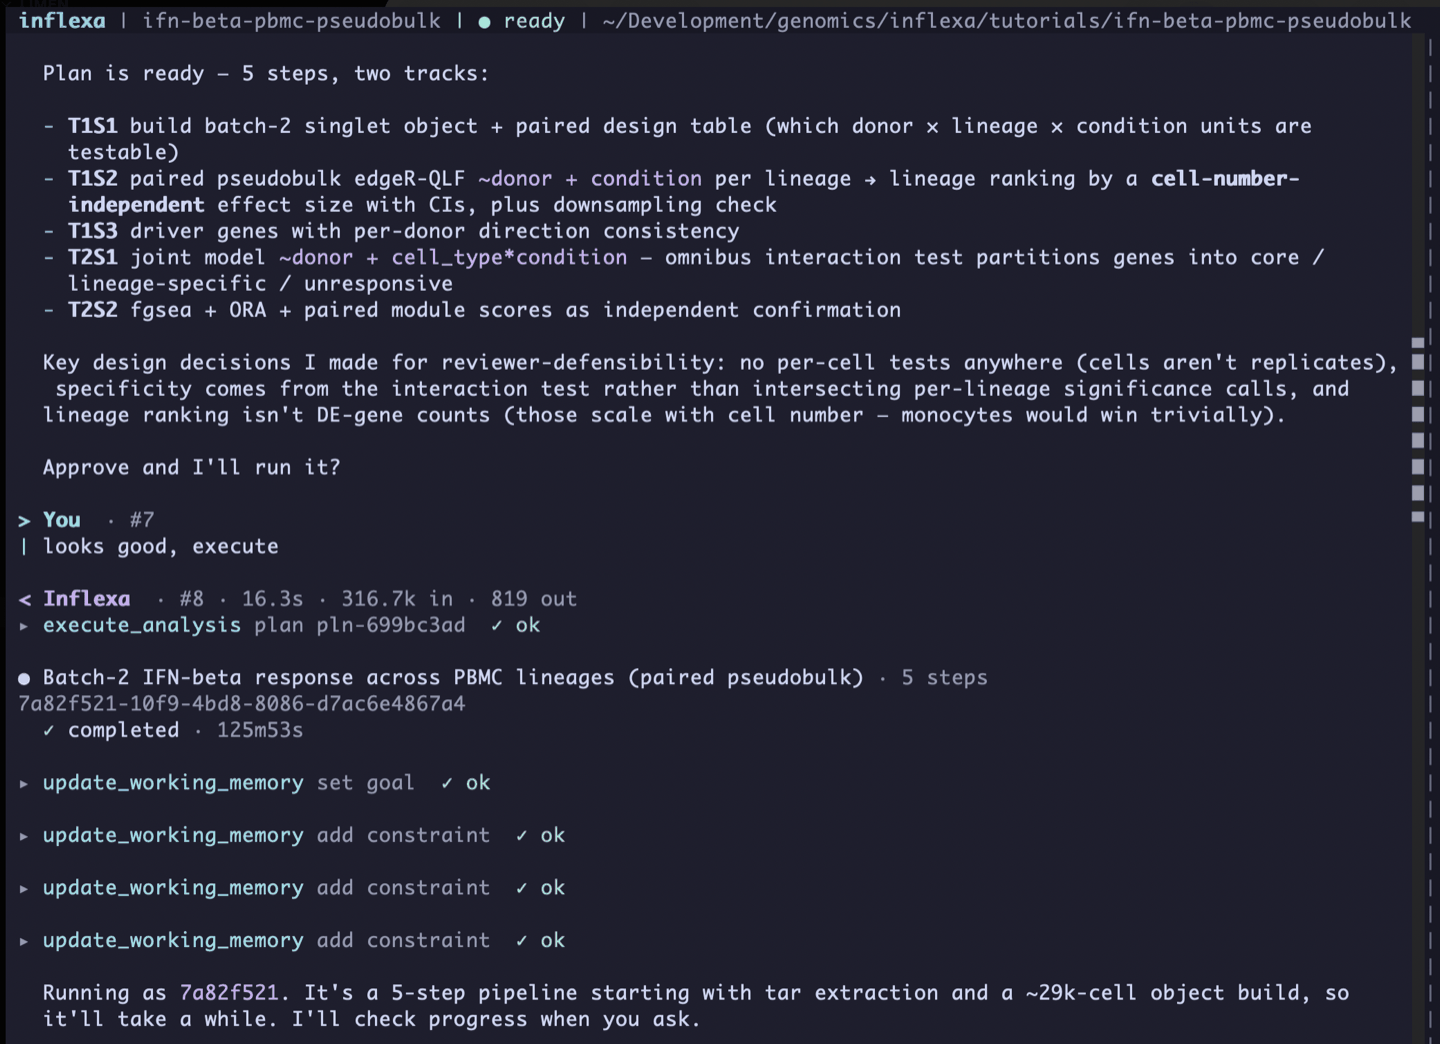
looks good, execute
Approved as written, the run detaches under identifier 7a82f521-10f9-4bd8-8086-d7ac6e4867a4 and completes five steps in 2 hours 6 minutes. Each step runs in the sandbox with no network access, writing figures, tables, logs, scripts and a provenance record as it goes.
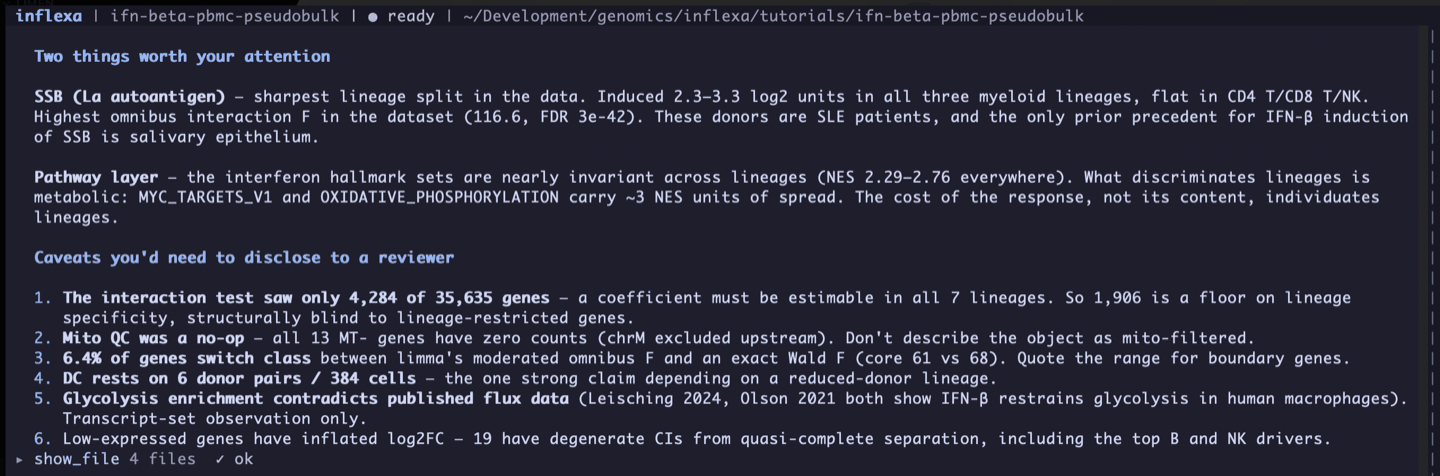
What comes back when it finishes is the whole result in one screen. Every number in it is unpacked in the sections below, and every one of them is traceable to a file in the run directory. The summary opens by reading one of those files back.
4. The object, and a QC filter that did nothing
The first step is bookkeeping, and bookkeeping is where single-cell analyses quietly break. The cascade from raw droplets to analysable cells:
| Stage | ctrl | stim | total |
|---|---|---|---|
| Loaded, batch 2 | 14,619 | 14,446 | 29,065 |
| demuxlet singlets | 12,315 | 12,364 | 24,679 |
| Cell-type labelled | 12,315 | 12,358 | 24,673 |
| QC passed | 12,261 | 12,301 | 24,562 |
4,386 droplets are dropped as doublets or ambiguous, 6 more carry no cell-type label, and 111 fail QC. The two arms end 40 cells apart, so the paired contrast is not being driven by differential recovery.
Two things in this step are worth more than the table. The first is the barcode join. The batch-2 metadata TSV has seven header names and eight fields per row, and 313 stimulated barcodes carry an R make.unique() mangling that would have made them fail to match the matrix. After correction the join is exact: 14,619 of 14,619 and 14,446 of 14,446, both arms at 100%, with a log line confirming no cell was lost and therefore no silent merge occurred.
The second is the mitochondrial filter, and it is the best example on this page of a check that earns its keep by failing.
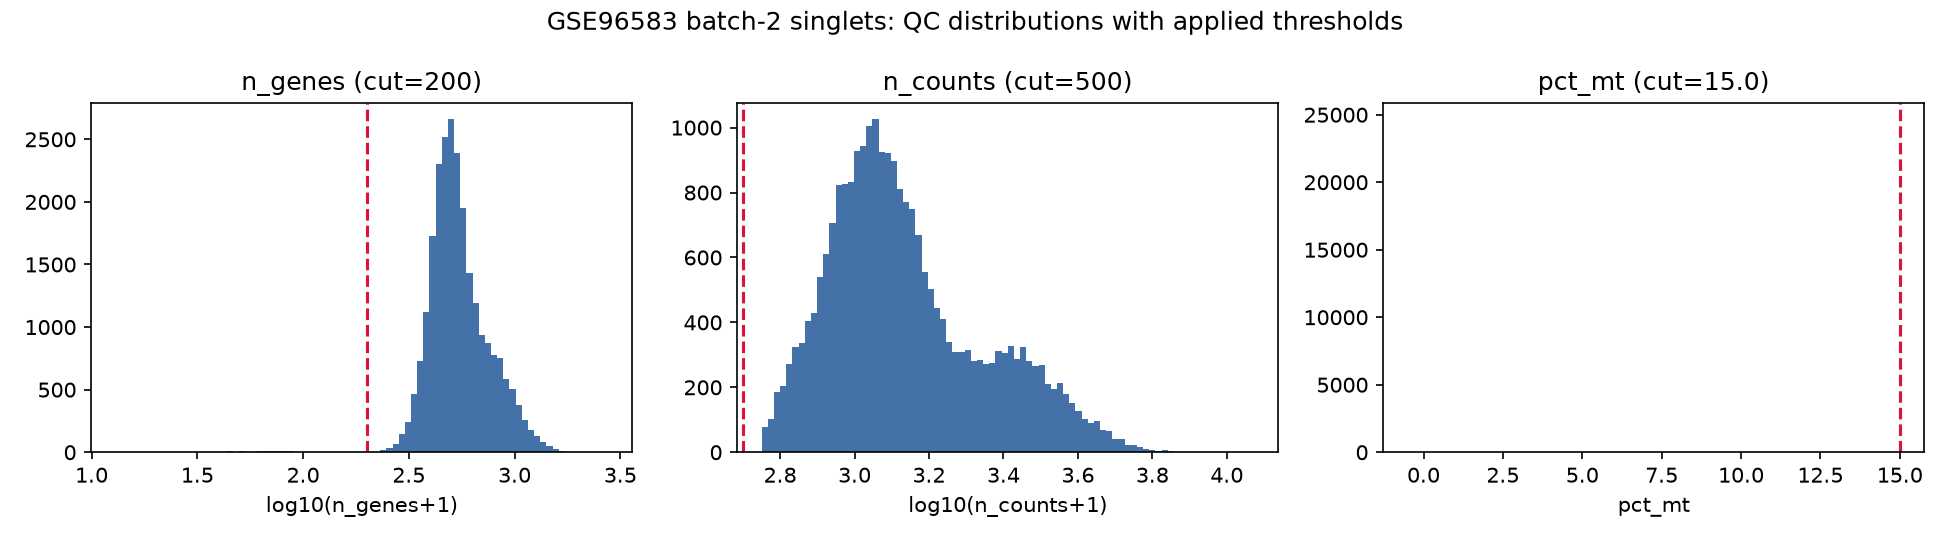
All 13 MT- genes carry zero total counts across every cell, because chrM was excluded before the matrices were deposited. The 15% mitochondrial threshold is therefore a no-op: it removed 0 cells, and no dying-cell filtering was achieved by it. The step's own summary states that any claim this object is mito-filtered would be false.
Of the three QC criteria, exactly one binds. The gene-count floor removes 111 cells; the UMI floor removes zero, because the deposited matrices were already cell-called and the lowest observed total is 562. The honest description of this step is that it confirms the cell set rather than reshaping it, and that is what the summary says.
From there the design is enumerated rather than assumed. The unit is donor × cell type × condition, giving a complete grid of 128. A unit is testable at 10 cells or more; a cell type qualifies only when at least 6 of the 8 donors have both arms testable. Seven of the eight types qualify. Megakaryocytes do not: 208 cells, only 4 donors paired. The summary names them and says which threshold they missed, so they are excluded rather than quietly absent.
Dendritic cells qualify at exactly the boundary: 6 of 8 donors, because donor 1039 has 9 control DCs and donor 107 has 8, both under the ten-cell floor. That number follows them through every remaining step on this page, and every step says so.
All eight donors (101, 107, 1015, 1016, 1039, 1244, 1256, 1488) appear in both arms, with none present in only one. The stimulation contrast is fully paired within donor, which is the property the whole design rests on. Nineteen verification checks confirm the object: shape, singlets only, batch-2 GSMs only, zero nulls in donor, condition and cell type, integer non-negative counts identical to the matrix, and the design table's cell counts and UMI totals re-derived from the object and matched.
5. Which lineages respond hardest, and on what scale
Raw UMI counts are summed per donor × cell type × condition, with no per-cell statistic anywhere, giving 108 analysable pseudobulk libraries out of the 128-unit grid. Each lineage is then fitted on its own matrix with edgeR quasi-likelihood, ~donor + condition, donor as a fixed blocking factor, and filtering applied per lineage so a lineage-specific low expresser is not lost to some other lineage's filter.
Before any ranking, look at what the libraries do on their own:
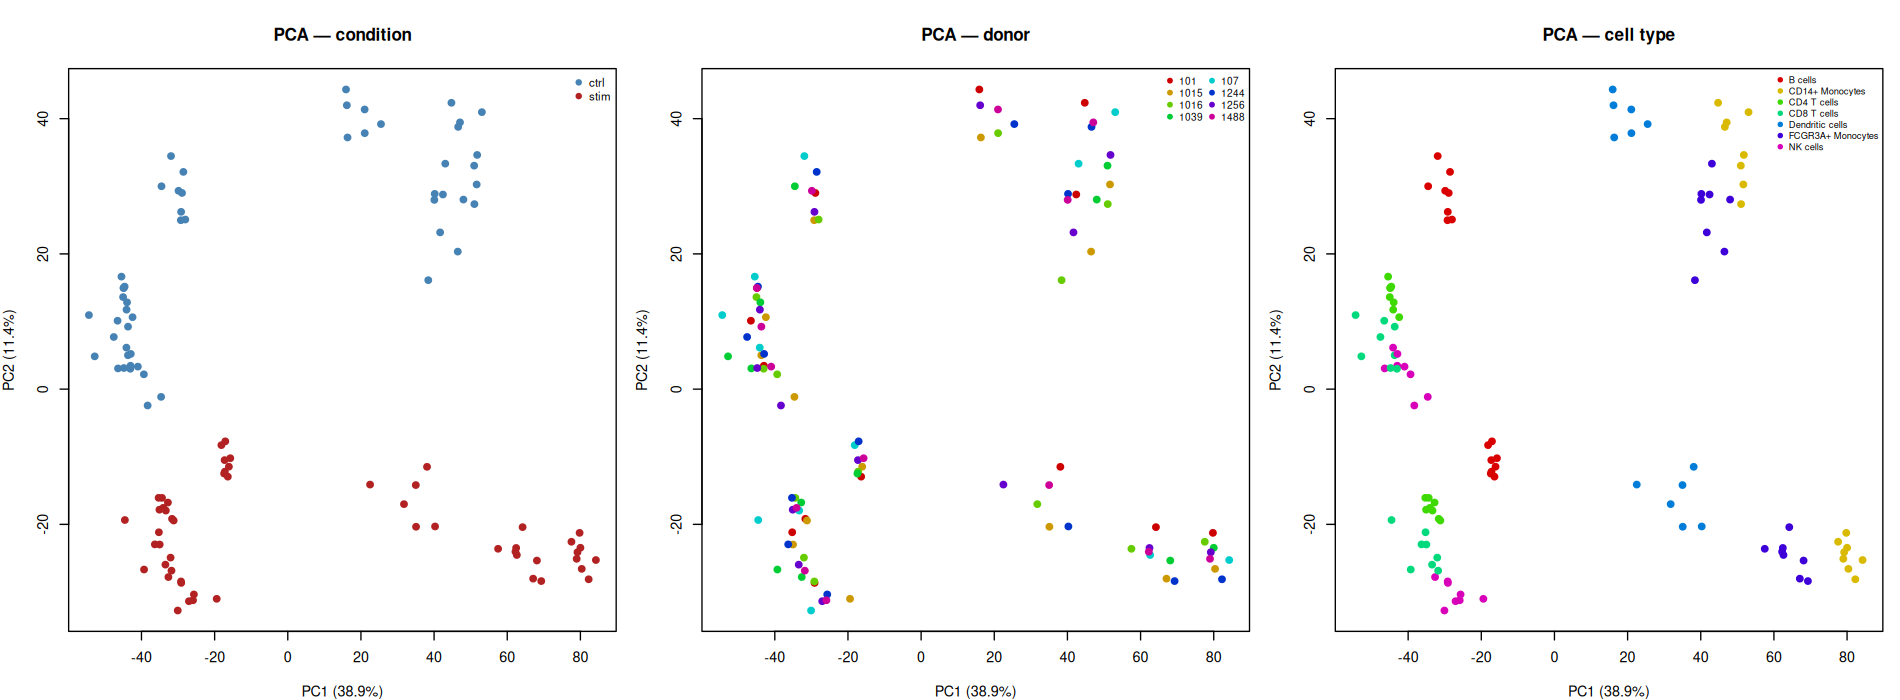
That ordering matters for everything that follows. Lineage identity, not the stimulus, is the dominant axis of variation in this experiment. The paired design is what makes the smaller axis, the one you actually care about, estimable at all.
The ranking statistic is a fixed 13-gene ISG panel (ISG15, IFI6, IFIT1, IFIT2, IFIT3, MX1, ISG20, OAS1, STAT1, IRF7, LY6E, RSAD2, CXCL10), scored per donor as the mean stimulated-minus-control difference in TMM-normalised log2 CPM, then tested with a one-sample t on the paired differences. Because it is a within-donor CPM ratio it is independent of library depth, and therefore of cell number.
| Lineage | ISG panel log2FC [95% CI] | Donors | DE genes | Cells | Rank, 15 cells |
|---|---|---|---|---|---|
| CD14+ Monocytes | 6.482 [5.507, 7.456] | 8 | 1,562 | 5,355 | 1 |
| Dendritic cells | 5.550 [5.246, 5.853] | 6 | 398 | 384 | 2 |
| CD4 T cells | 5.266 [4.825, 5.706] | 8 | 455 | 10,373 | 6 |
| B cells | 5.262 [4.835, 5.689] | 8 | 346 | 2,571 | 4 |
| FCGR3A+ Monocytes | 4.702 [4.105, 5.298] | 8 | 695 | 1,592 | 3 |
| CD8 T cells | 4.434 [4.154, 4.713] | 8 | 132 | 2,040 | 7 |
| NK cells | 4.291 [3.931, 4.651] | 8 | 262 | 1,991 | 5 |
Read the fourth and fifth columns against the second. Dendritic cells sit second on effect size from 384 cells, while FCGR3A+ monocytes sit fifth despite having the second-highest DE-gene count. Ranking on counts would have swapped them. Effect size and DE count agree at only Spearman 0.714, and DE count is not even monotone in cell number, at Spearman 0.214, because both the number of cells and the intrinsic response feed it. That is what makes it unusable as a magnitude scale, and it is the reason the plan ruled it out before the numbers existed.
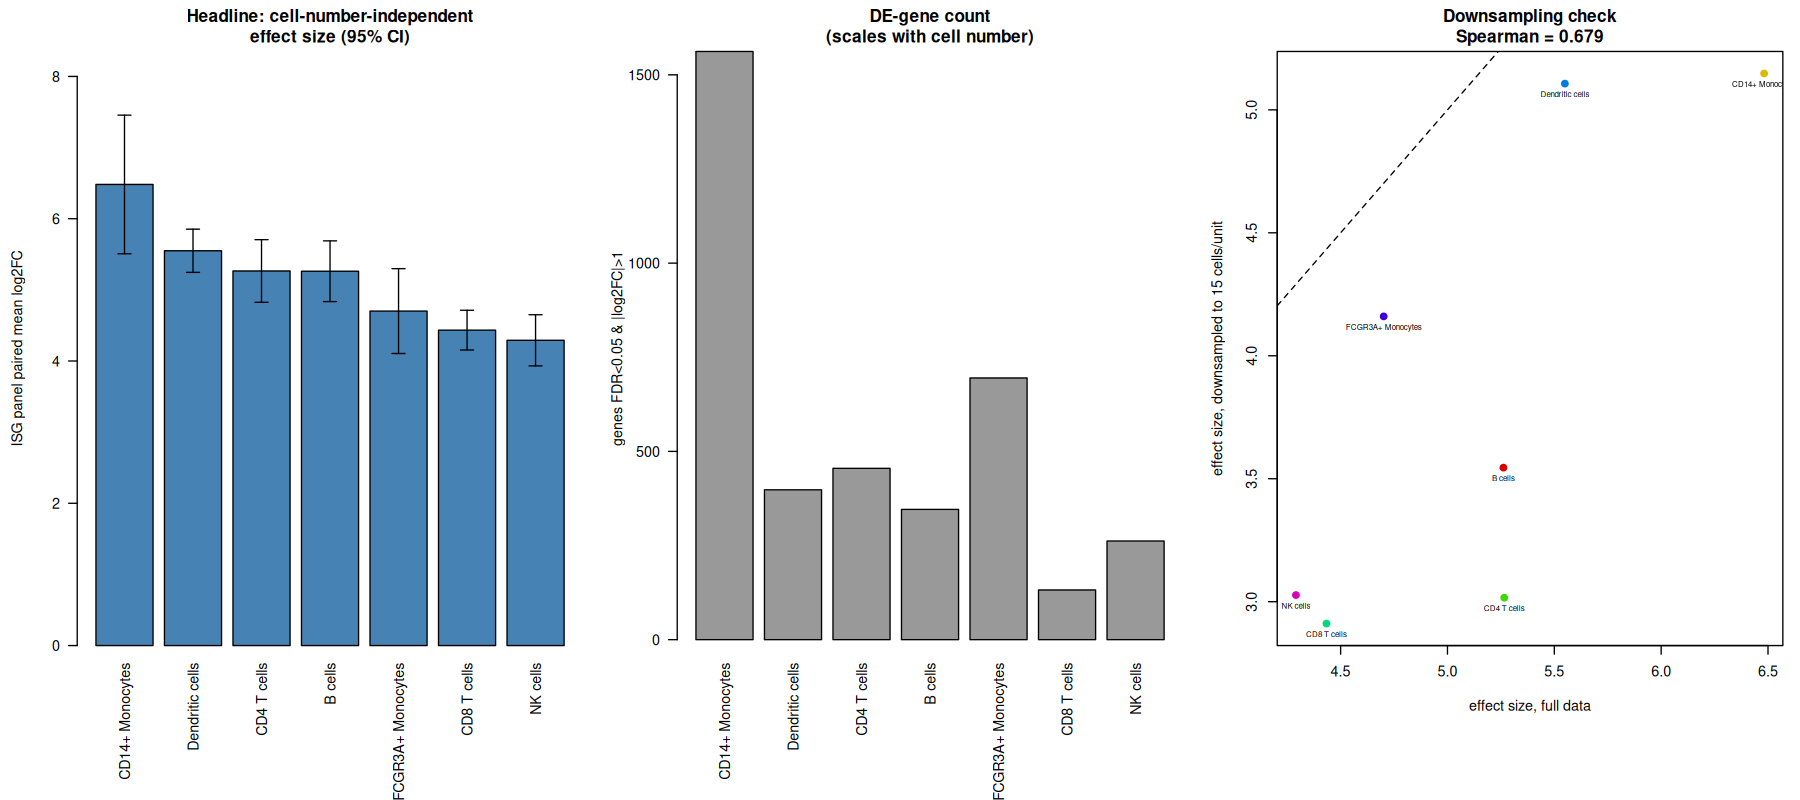
Then the check that decides how much of the ranking survives. Every analysed unit was downsampled to 15 cells per donor per condition, the size of the smallest analysed unit, and the entire pipeline re-run on three independent seeds.
The top of the table holds and the middle does not. Top-1 and top-2 are identical; top-3 is not; maximum rank displacement is three positions, with CD4 T cells falling from 3rd to 6th. One structure actually gets cleaner at equal cell numbers: all three myeloid lineages sit above all four lymphoid lineages after downsampling, which is not true in the full data. Seed-to-seed variation is small next to the depth effect, so the instability is caused by 15-cell libraries rather than by sampling noise.
The defensible reading is stated in the step's own summary: CD14+ monocytes and dendritic cells are the two strongest responders, and that claim survives equalising cell number. The finer ordering among the lymphoid lineages does not survive, and is not asserted anywhere.
Two more limits stay attached. The ISG panel is a prespecified instrument, not a neutral one: a lineage responding through non-ISG programmes would be underrated by it. And dendritic cells rest on 6 donor pairs and 384 cells, carrying the highest biological coefficient of variation (0.185) and the lowest prior degrees of freedom (11.38) of any lineage. Their rank-2 position is the one strong claim in the run that depends on a reduced-donor lineage. It is also the claim downsampling strengthens most.
A limma-voom refit on all seven lineages, same design and same normalised object, agrees on effect almost exactly, at Spearman 0.987 to 0.999 on fold changes, and disagrees systematically on significance. voom calls more genes in every single lineage: 96.7% to 99.5% of edgeR's calls are recovered by voom, but only 80.9% to 98.0% of voom's are recovered by edgeR. The direction of that gap is reported rather than averaged away, with edgeR-QLF named as the more conservative caller and kept as primary.
6. What drives each lineage, and whether the donors agree
Driver selection uses two rankings rather than one. Within each lineage, genes at FDR below 0.05 are ranked by absolute log2 fold change (effect) and by quasi-likelihood F (evidence), and the union of the two top-25 lists becomes that lineage's driver set. The two lists are genuinely different instruments: they overlap in as few as 2 genes in CD14+ monocytes and as many as 14 in CD8 T cells, giving 36 to 48 drivers per lineage and 291 rows in total.
The largest-effect driver in five of seven lineages is a chemokine:
| Lineage | Top driver | log2FC | 95% CI | FDR | Donors |
|---|---|---|---|---|---|
| CD14+ Monocytes | CCL8 | 9.577 | [8.614, 10.540] | 6.6e-07 | 8/8 |
| B cells | CXCL11 | 9.176 | degenerate | 6.8e-16 | 8/8 |
| NK cells | CXCL10 | 8.944 | degenerate | 9.8e-20 | 8/8 |
| FCGR3A+ Monocytes | CCL8 | 8.908 | [7.410, 10.405] | 6.5e-11 | 8/8 |
| Dendritic cells | IFIT2 | 8.781 | [6.545, 11.016] | 2.7e-14 | 6/6 |
| CD4 T cells | CXCL10 | 7.801 | [7.107, 8.495] | 1.3e-45 | 8/8 |
| CD8 T cells | CXCL10 | 6.309 | [4.213, 8.405] | 1.1e-13 | 8/8 |
CCL8 tops both monocyte subsets, CXCL10 tops all three of CD4 T, CD8 T and NK, CXCL11 tops B cells, and IFIT2 tops dendritic cells. Six genes are top-25 drivers in all seven lineages: CXCL10, IFIT1, IFIT2, IFIT3, RSAD2 and ISG15. That is the first hint of what the interaction test will later make formal, which is that the lineages share a repertoire and differ in gain.
Two of those confidence intervals read "degenerate", and that is the run's own flag rather than a rendering failure. Genes that are near-absent in control produce quasi-complete separation, which leaves the deviance-based FDR valid and the Wald interval meaningless. 17 of the 291 driver rows carry the flag. They are marked in the tables rather than dropped or shipped silently, and ranking by absolute fold change is noted as being systematically enriched for exactly this failure mode.
The consistency check is the part that would be hard to fake. 285 of the 291 driver rows move in the model's direction in every single donor. The largest single donor's share of the summed per-donor effect has a median of 0.147 to 0.193 per lineage, against 0.125 for a perfectly even eight-donor split. The leading drivers are carried by all the donors at roughly equal weight, not by one enthusiastic outlier.
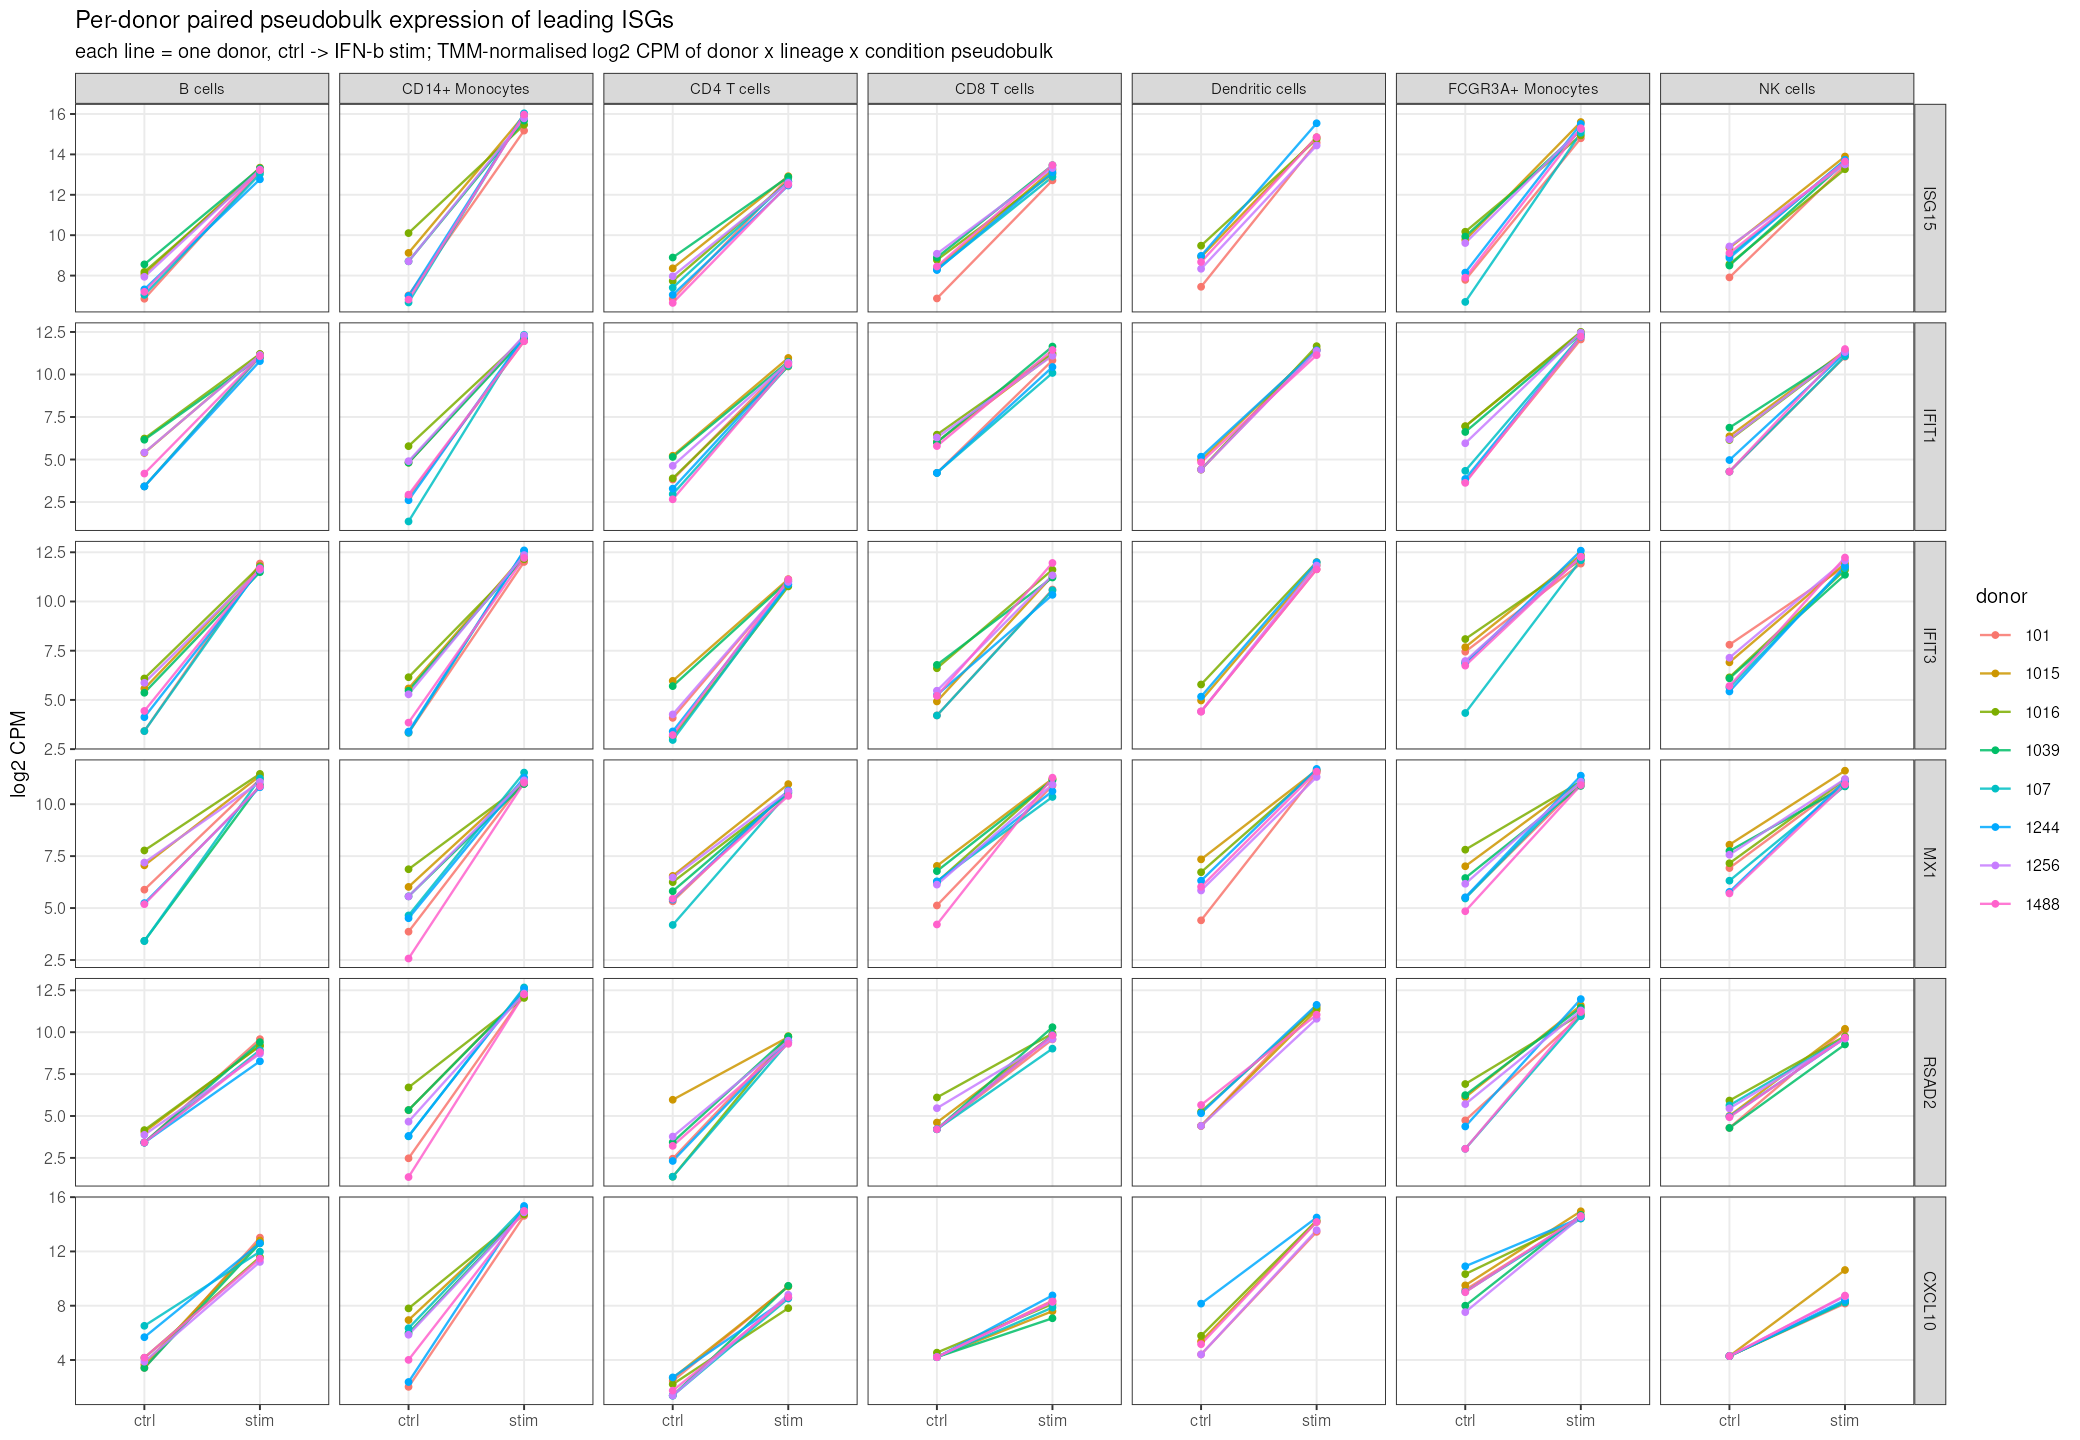
Exactly one driver is disqualified. CXCL13 in FCGR3A+ monocytes has an FDR of 7.0e-04 and a log2 fold change of 5.03, and would have read as a finding. But only 5 of 8 donors move in the model's direction, donor 1488 supplies 55% of the summed effect, and the leave-one-donor-out mean collapses to 0.42. It trips two independent flags, and the summary states plainly that it should not be reported as an IFN-β driver.
The cross-lineage heatmap is where a reader is most likely to over-read, so the figure argues against itself in its own title:
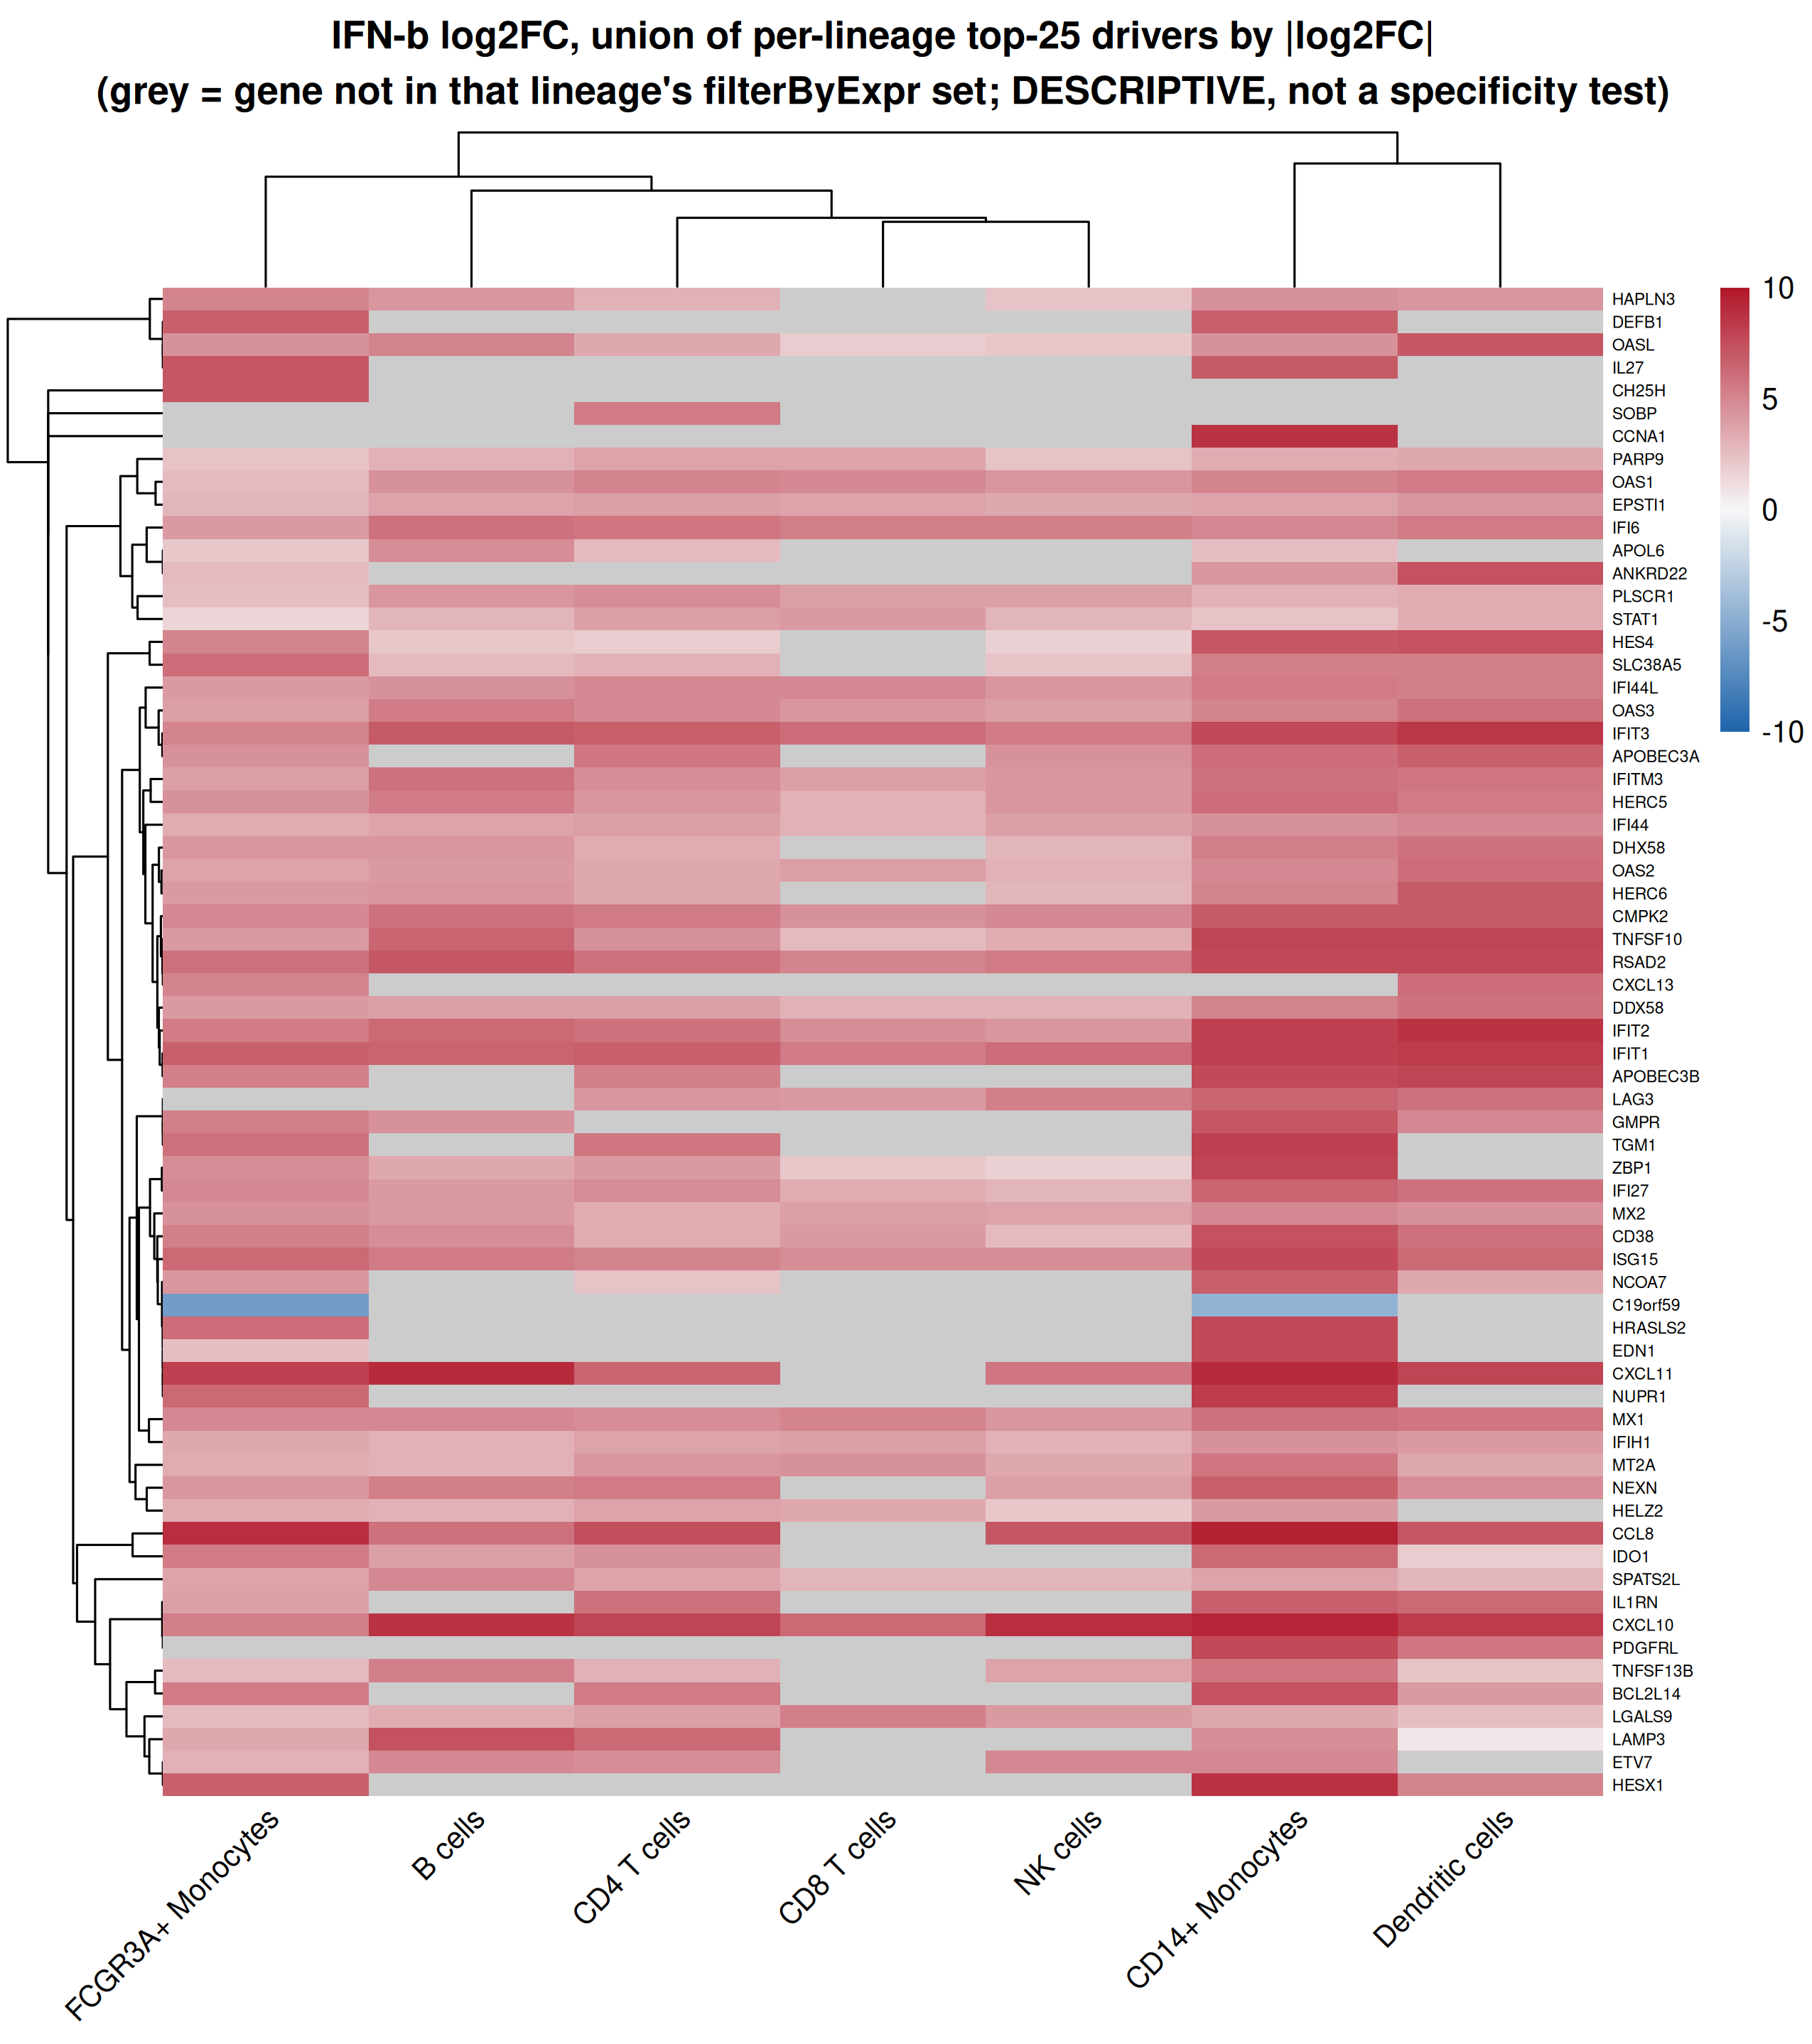
The step gives two concrete reasons the eye will mislead here. Missingness is structural: CXCL11 is untested in CD8 T cells, LAMP3 in CD8 T and NK, and none of those cells carries a zero. And topping one lineage's list is not specificity. Of the 25 genes that appear in exactly one lineage's top-25, 17 are not even tested in all seven lineages and 22 are significant with a fold change above 1 in more than one. ZBP1 tops only the CD14+ monocyte list yet is significant in all six lineages where it is tested. Deciding specificity, the step says, requires the interaction test in the next step.
One check compared the edgeR model coefficient against the mean per-donor log-CPM difference and failed at a naive correlation threshold. Split by expression tertile, the reason is visible: agreement is near-perfect for well-expressed genes (Pearson 0.970) and degrades badly for low-expressed ones (0.778, with the model estimate exceeding the per-donor ratio by a mean of 1.93 log2 units).
The two are different estimators. The per-donor ratio applies a prior count that shrinks hardest where counts are sparse; the GLM coefficient does not. Sign agreement is 291 of 291. So the check was rewritten to test the directional claim the step actually makes, and the magnitude divergence was reported as a practical consequence instead of being thresholded away: for low-expressed drivers, read the per-donor panels for direction and consistency, not as a second effect size.
7. Core versus lineage-specific, decided by a test
This is the step the plan promised and the one the whole design was arranged around. A single joint limma-voom fit asks, per gene, whether the seven per-lineage condition effects can be treated as equal. The design is ~ donor + cell_type * condition with sum-to-zero coding on cell type, all 108 libraries, 21 design columns at full rank, and 87 residual degrees of freedom.
The sum-to-zero coding is what makes the answer interpretable rather than arbitrary: under it the condition coefficient is the unweighted mean of the seven per-lineage effects, and each interaction coefficient is one lineage's deviation from that mean. The step checks this numerically. The mean of the per-lineage estimates matches the averaged coefficient to 5.3e-15, the seven deviations sum to 6.1e-16, and the averaged effect is confirmed not to be any single lineage's effect in disguise.
The partition of the 4,284 jointly testable genes:
| Class | Genes | % of tested | Definition |
|---|---|---|---|
| core | 61 | 1.42% | significant averaged effect, no detectable interaction |
| lineage-specific | 1,906 | 44.49% | significant omnibus interaction |
| unresponsive | 2,317 | 54.08% | neither |
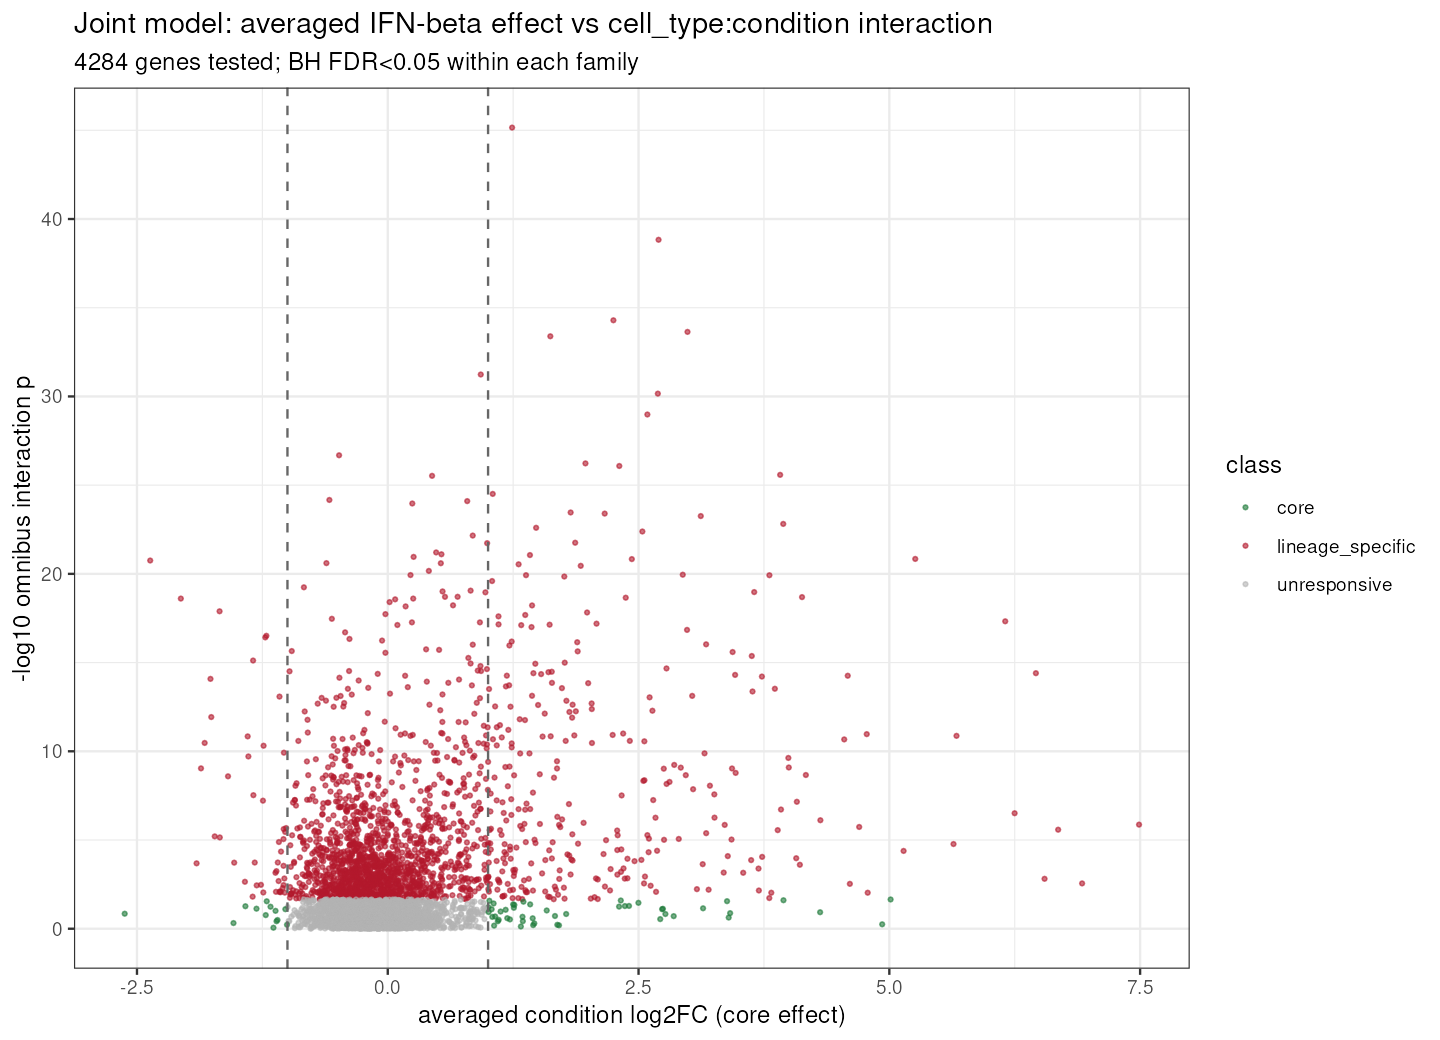
The interaction outnumbers the uniform core by roughly thirty to one. The core genes are the ones you would nominate for a compartment-agnostic readout: MX1, IFI44L, IFI27, ETV7, IRF7, STAT2, LGALS3BP, SPATS2L, PARP10, PARP11, DTX3L, MOV10, C19orf66. The genes that are not in it are the surprise: CXCL10, IFIT2, TNFSF10, OASL, CCL8, CXCL11, SOCS1, CD38 and IFITM2 all classify as lineage-specific. They are induced everywhere. They are not induced equally, and the test can tell.
The interaction has a direction, and it is one axis:
| Lineage | Compartment | Stronger | Weaker | Opposite | Responds where average is flat |
|---|---|---|---|---|---|
| CD14+ Monocytes | myeloid | 857 | 41 | 46 | 365 |
| FCGR3A+ Monocytes | myeloid | 347 | 59 | 25 | 114 |
| Dendritic cells | myeloid | 194 | 28 | 31 | 65 |
| B cells | lymphoid | 98 | 125 | 108 | 112 |
| CD4 T cells | lymphoid | 64 | 359 | 215 | 110 |
| CD8 T cells | lymphoid | 12 | 175 | 122 | 52 |
| NK cells | lymphoid | 26 | 136 | 109 | 63 |
Every myeloid lineage is dominated by stronger-than-average contrasts and every lymphoid lineage by weaker. This reproduces the lineage ranking from step 5 using a completely different statistic. There it was a per-donor ISG panel effect size; here it is a coefficient-equality test that never sees the panel. Two independent instruments landing on the same axis is what licenses the biological claim.
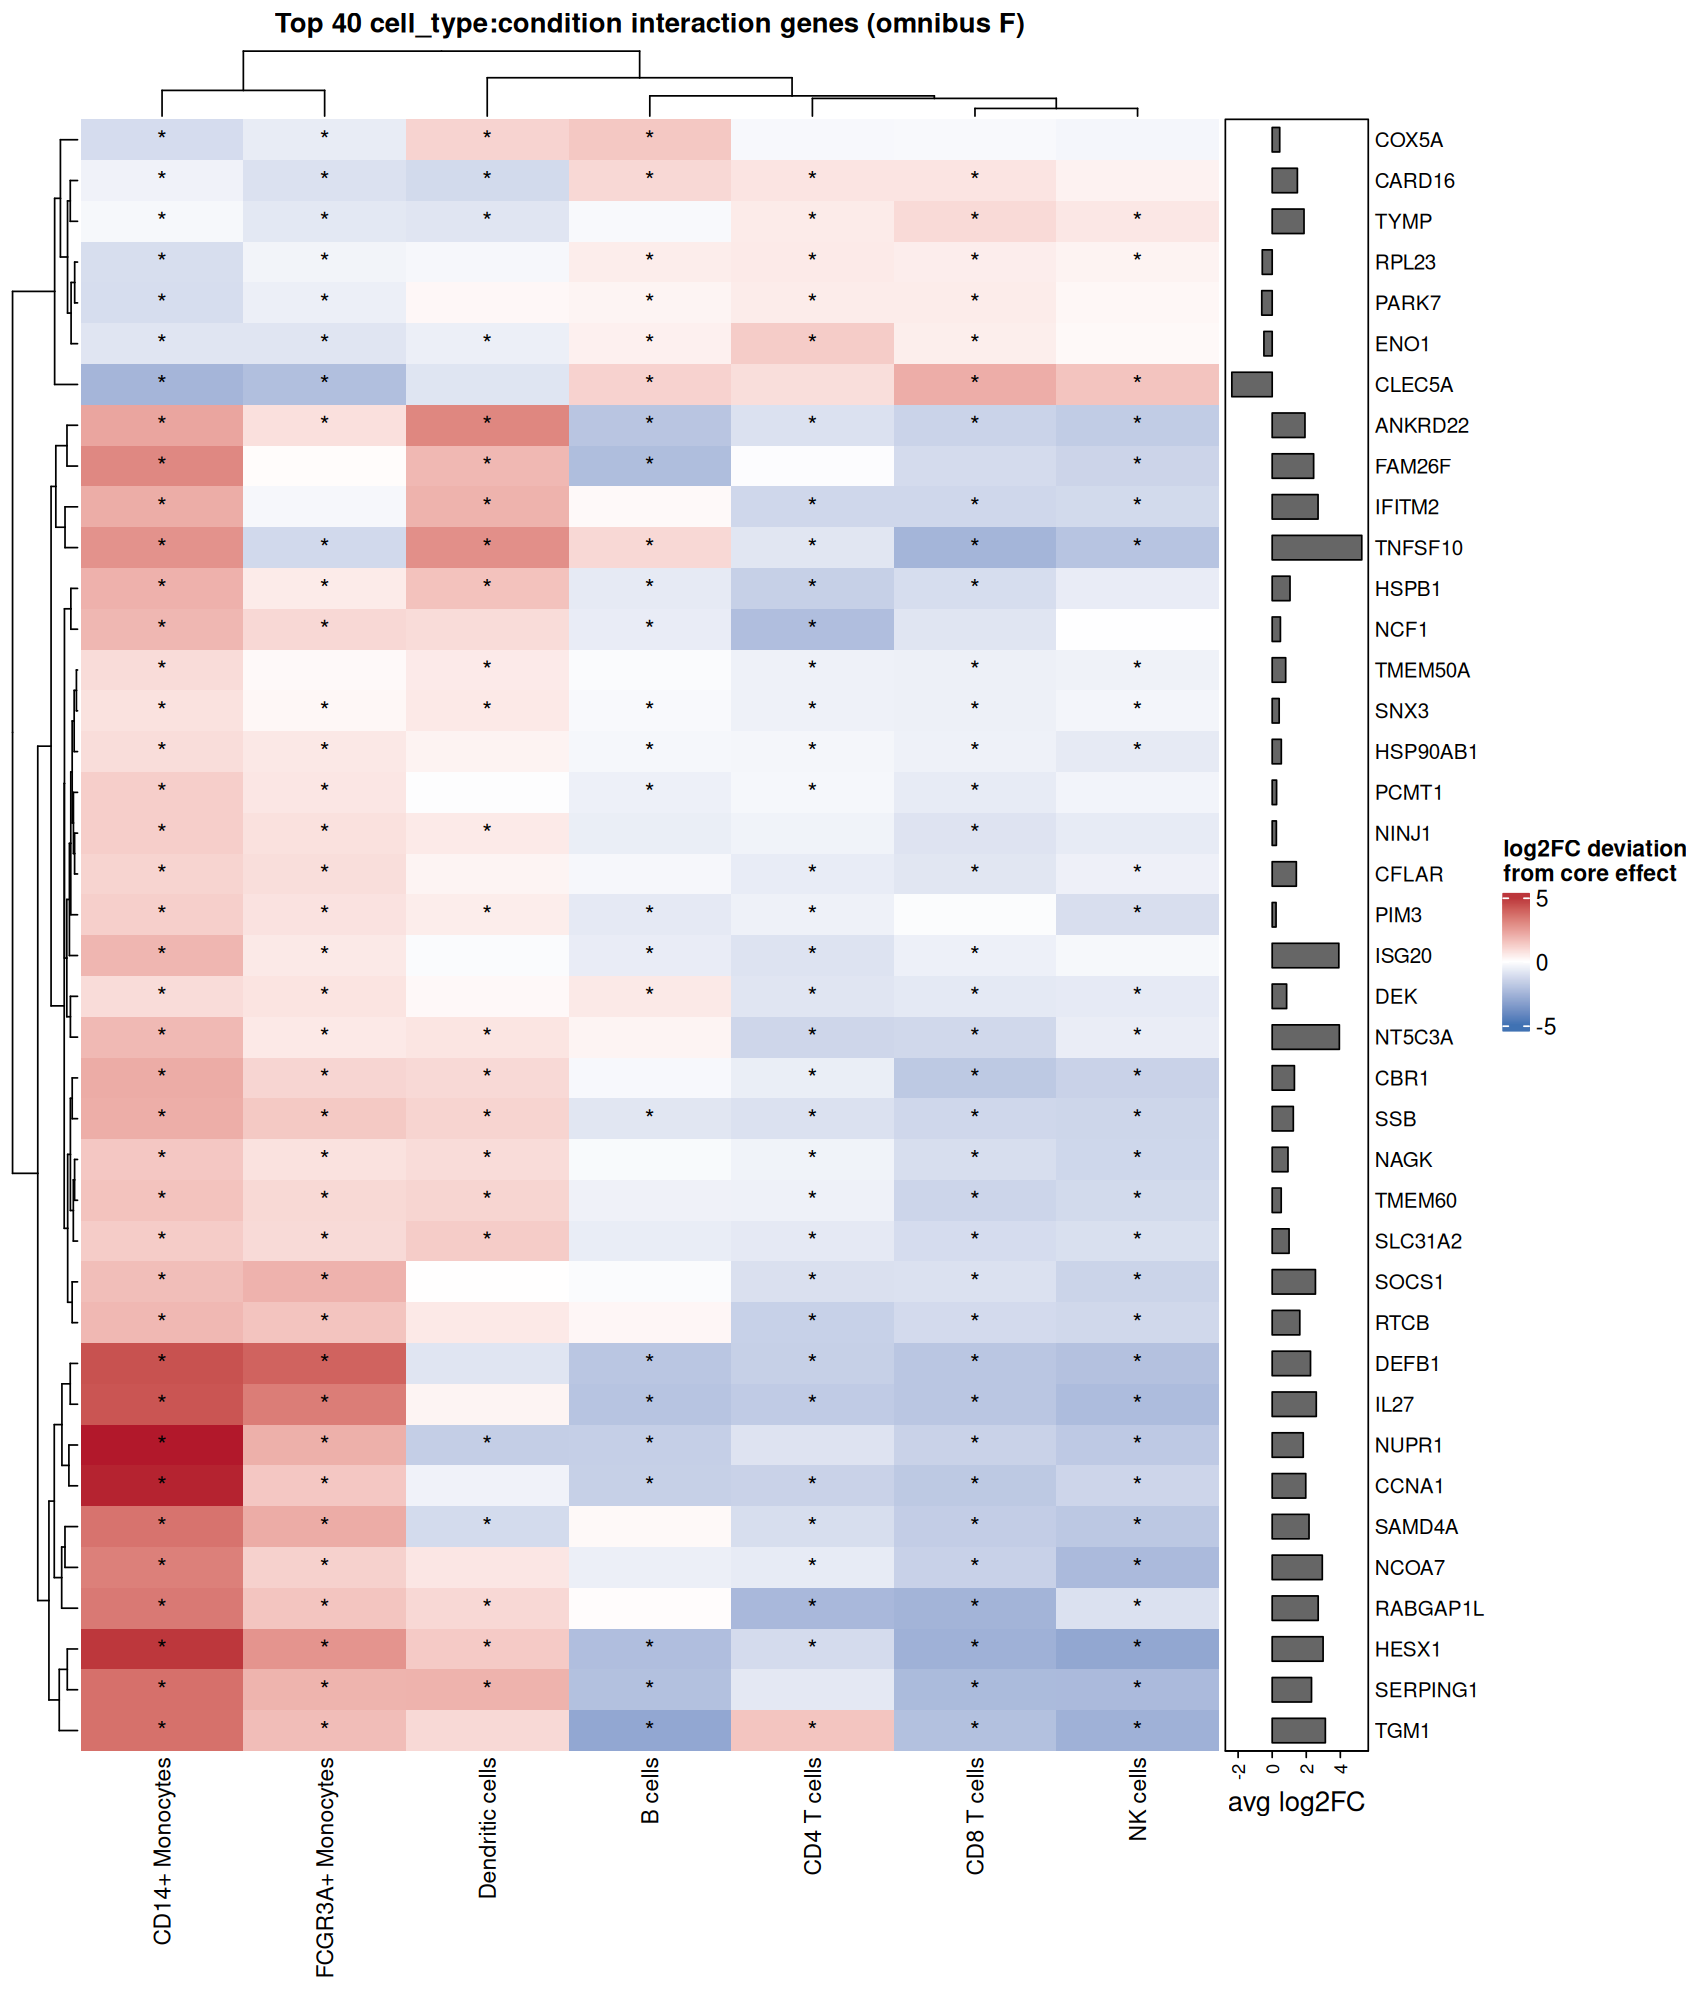
The interaction test estimates six contrasts where the main effect estimates one, so it is strictly less powerful. A gene lands in the core when no departure from uniformity was detectable, which is not the same as being proven identical. The step names this asymmetry and handles it: core membership additionally requires an averaged fold change of at least 1, so low-power genes cannot drift into the core by default.
With 87 residual degrees of freedom and effects reaching five log2 units, the interaction test is well powered here. "Core" means uniform in magnitude, which is a strict criterion, and 61 genes meeting it is a measurement rather than an absence.
Three sensitivity analyses sit behind those numbers, and one of them moves them. Donor handling does not: refitting with donor as a random block instead of a fixed factor gives Jaccard 0.89 to 0.93 on the interaction set, and the fitted intra-donor correlation with donor removed from the design is only 0.048, so a random donor effect would recover almost nothing.
The choice of F statistic does move them. limma's moderated omnibus F rotates moderated t-statistics by one shared correlation matrix, while voom weights make the true coefficient correlation gene-specific. Against an exact per-gene Wald F the two agree at Spearman 0.976, but 274 genes, 6.40% of the total, change class (core 61 versus 68, lineage-specific 1,906 versus 1,846), and the switchers sit at the decision boundary, with a median limma FDR of 0.0437 against an exact FDR of 0.0602. Both statistics ship per gene, limma's is named primary and why, and the summary instructs that genes near the boundary are provisional and the counts should not be quoted without the range.
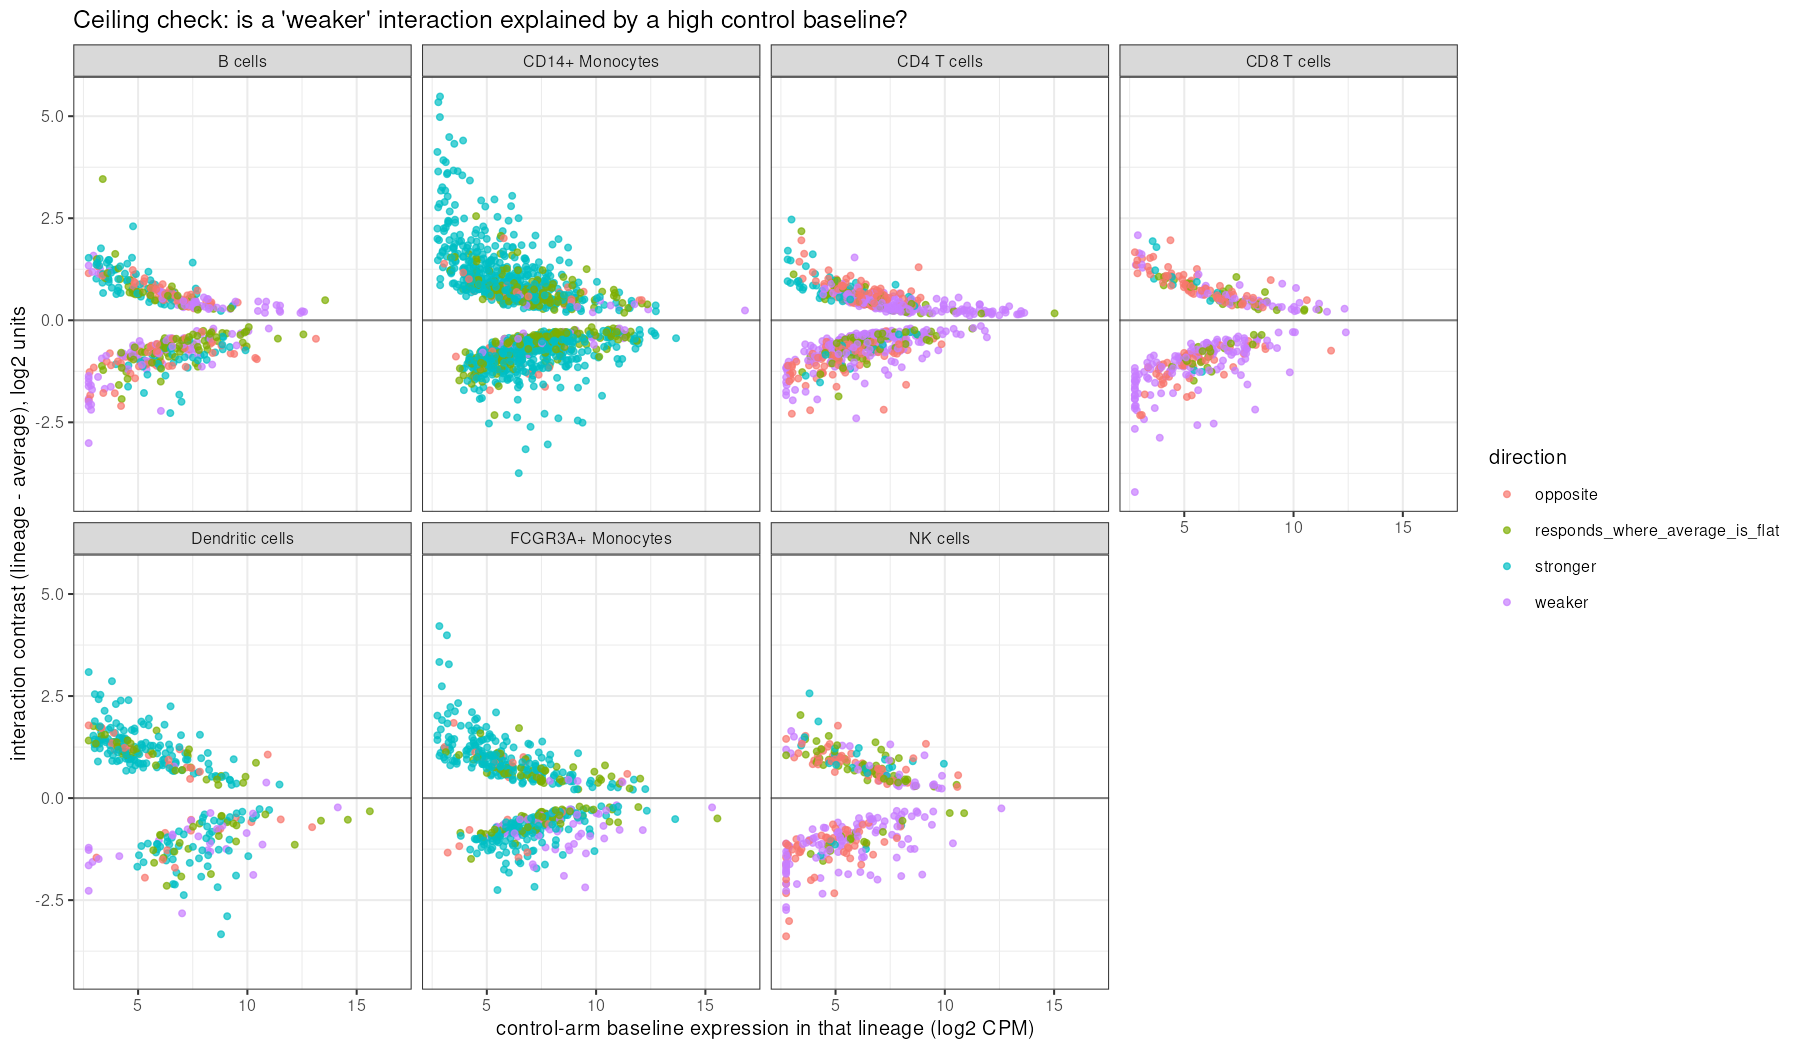
One more check earns its place. A lineage can look like a weak responder because it started high, so every weaker-than-average call was tested against its own control baseline:
The joint model tested 4,284 of 35,635 genes, because a coefficient has to be estimable in all seven lineages. 4,267 genes were tested in at least one per-lineage fit but only 1,101 in all seven.
So the partition is structurally blind to strictly lineage-restricted genes, precisely the class in which the interaction would be most extreme. 1,906 is a floor on lineage specificity, not an estimate of it, and the summary says so in those words.
8. SSB, and the label the run put on it
SSB carries the highest omnibus interaction F in the dataset, 116.6 at FDR 3.0e-42, and the sharpest lineage split of any gene tested. All seven per-lineage contrasts are individually significant with intervals excluding zero.
| Lineage | Condition log2FC | Deviation | 95% CI | Direction |
|---|---|---|---|---|
| CD14+ Monocytes | +3.315 | +2.075 | [+1.855, +2.295] | stronger |
| FCGR3A+ Monocytes | +2.626 | +1.386 | [+1.110, +1.662] | stronger |
| Dendritic cells | +2.340 | +1.100 | [+0.673, +1.527] | stronger |
| B cells | +0.400 | -0.839 | [-1.129, -0.550] | weaker |
| CD4 T cells | +0.237 | -1.003 | [-1.225, -0.782] | weaker |
| CD8 T cells | -0.093 | -1.333 | [-1.774, -0.892] | opposite |
| NK cells | -0.147 | -1.386 | [-1.764, -1.009] | opposite |
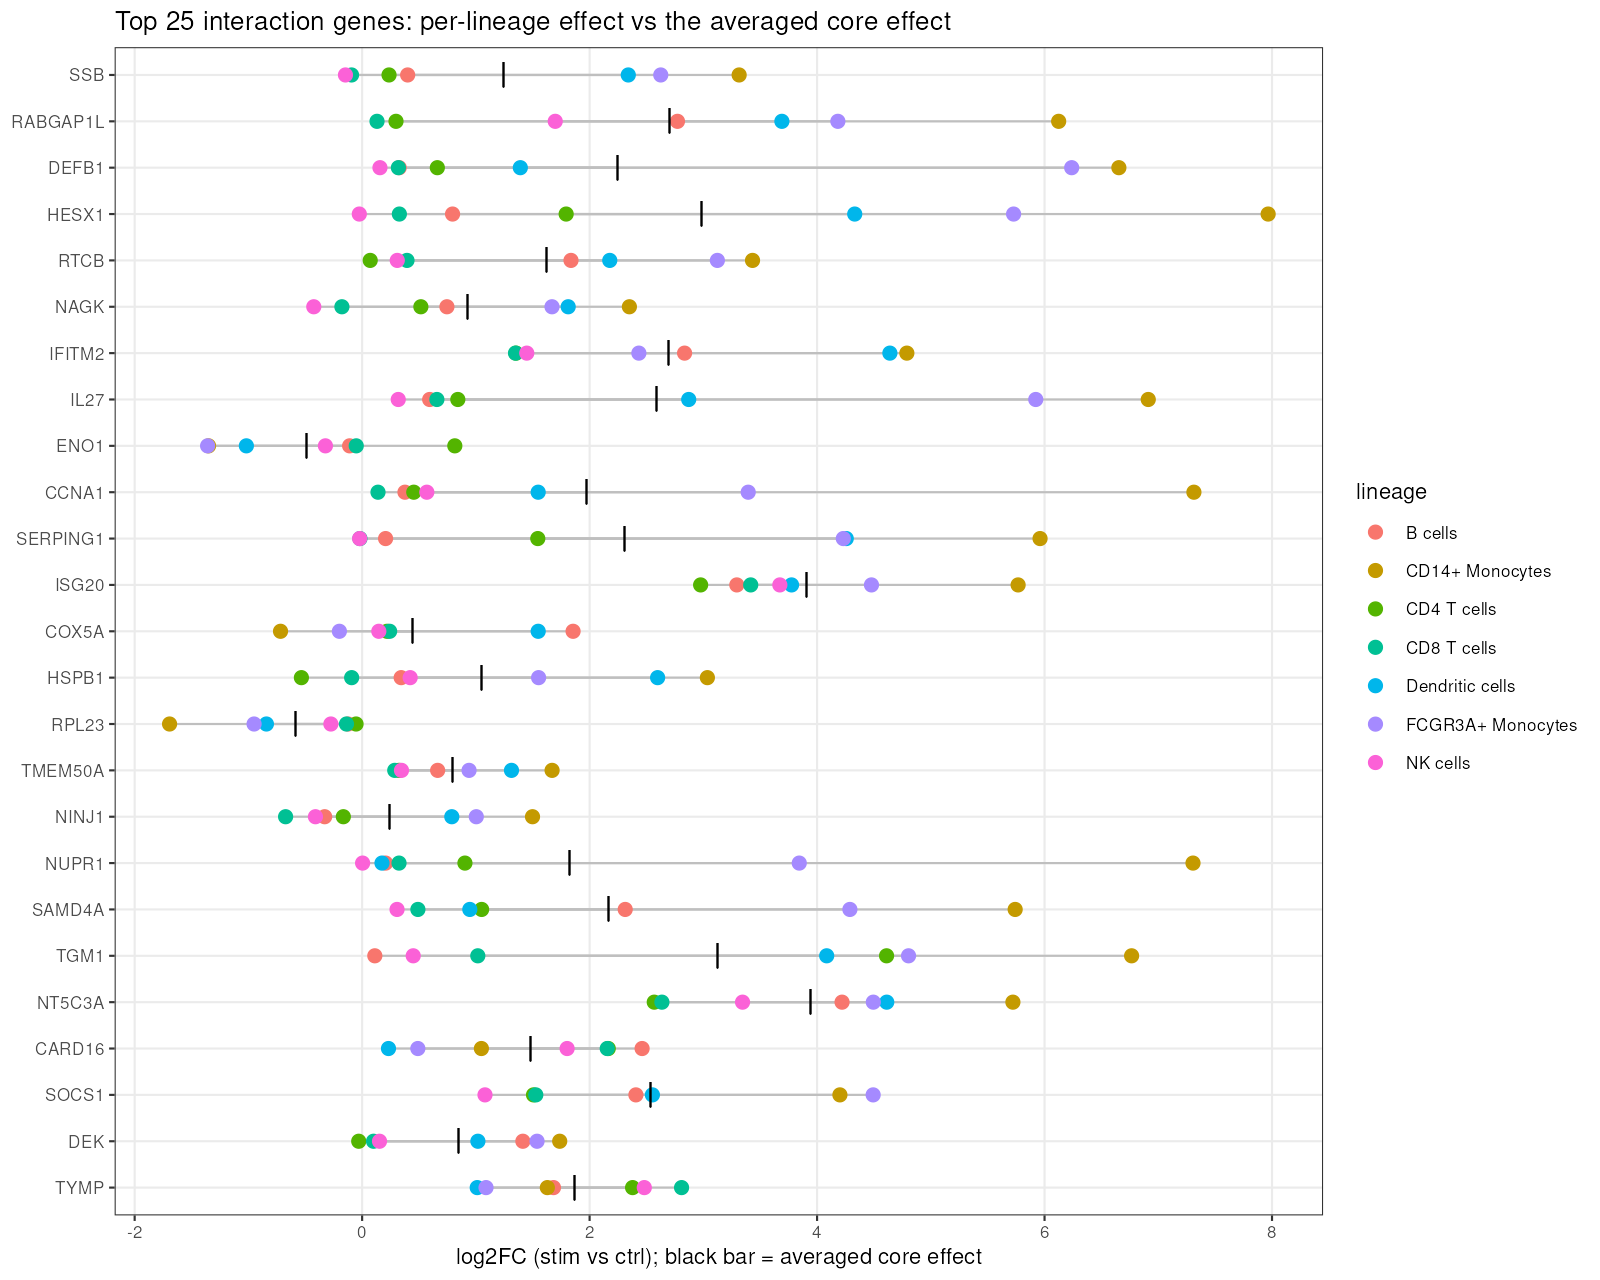
SSB encodes La, one of the classical lupus and Sjögren autoantigens. The donors here are lupus patients, and the compartment where the type I interferon signature is measured clinically is the monocyte compartment. So a result showing that IFN-β induces the autoantigen specifically in myeloid cells is exactly the shape of a mechanism, which is why the more interesting thing is what the run does with it.
Three limits are attached to the claim at the point of making it, not in a footnote. The only prior mechanistic precedent for IFN-β induction of SSB is in salivary gland epithelium, a non-haematopoietic system, at around two-fold and with no protein change. A 2.3 to 3.3 log2 unit effect in human PBMCs far exceeds that, and wants protein-level confirmation. This is mRNA at six hours in cryopreserved cells. And because no donor clinical covariates ship with the data, the hypothesis cannot be tested against autoantibody titre or disease activity anywhere inside this run.
The word the run uses for it is "hypothesis". Not "finding", not "novel target". The report's own section heading is SSB/La: the sharpest lineage split, and a hypothesis rather than a result, and that is the correct altitude for a six-hour ex-vivo stimulation with one epithelial precedent behind it.
9. What the response actually costs
The pathway step resolves an apparent tension in the interaction result. If 1,906 genes deviate by lineage, why do the interferon hallmark sets score almost identically in every lineage?
Because the deviating genes are not, in aggregate, interferon effectors. Ranked by how much their enrichment scores vary across the seven lineages, the sets that discriminate are metabolic, at 7.5 times the spread of the interferon sets:
| Hallmark set | NES range across lineages | Core NES | Core FDR |
|---|---|---|---|
| MYC_TARGETS_V1 | 3.002 | -1.692 | 1.1e-04 |
| OXIDATIVE_PHOSPHORYLATION | 2.967 | -2.079 | 1.6e-07 |
| GLYCOLYSIS | 2.851 | +0.855 | 0.799 (ns) |
| HYPOXIA | 2.647 | +0.896 | 0.799 (ns) |
| PEROXISOME | 2.540 | -1.325 | 0.271 (ns) |
| UNFOLDED_PROTEIN_RESPONSE | 2.293 | +0.987 | 0.735 (ns) |
| INTERFERON_GAMMA_RESPONSE | 0.434 | +2.711 | 9.9e-53 |
| INTERFERON_ALPHA_RESPONSE | 0.400 | +2.758 | 1.6e-44 |
| INFLAMMATORY_RESPONSE | 0.386 | +1.915 | 5.0e-06 |
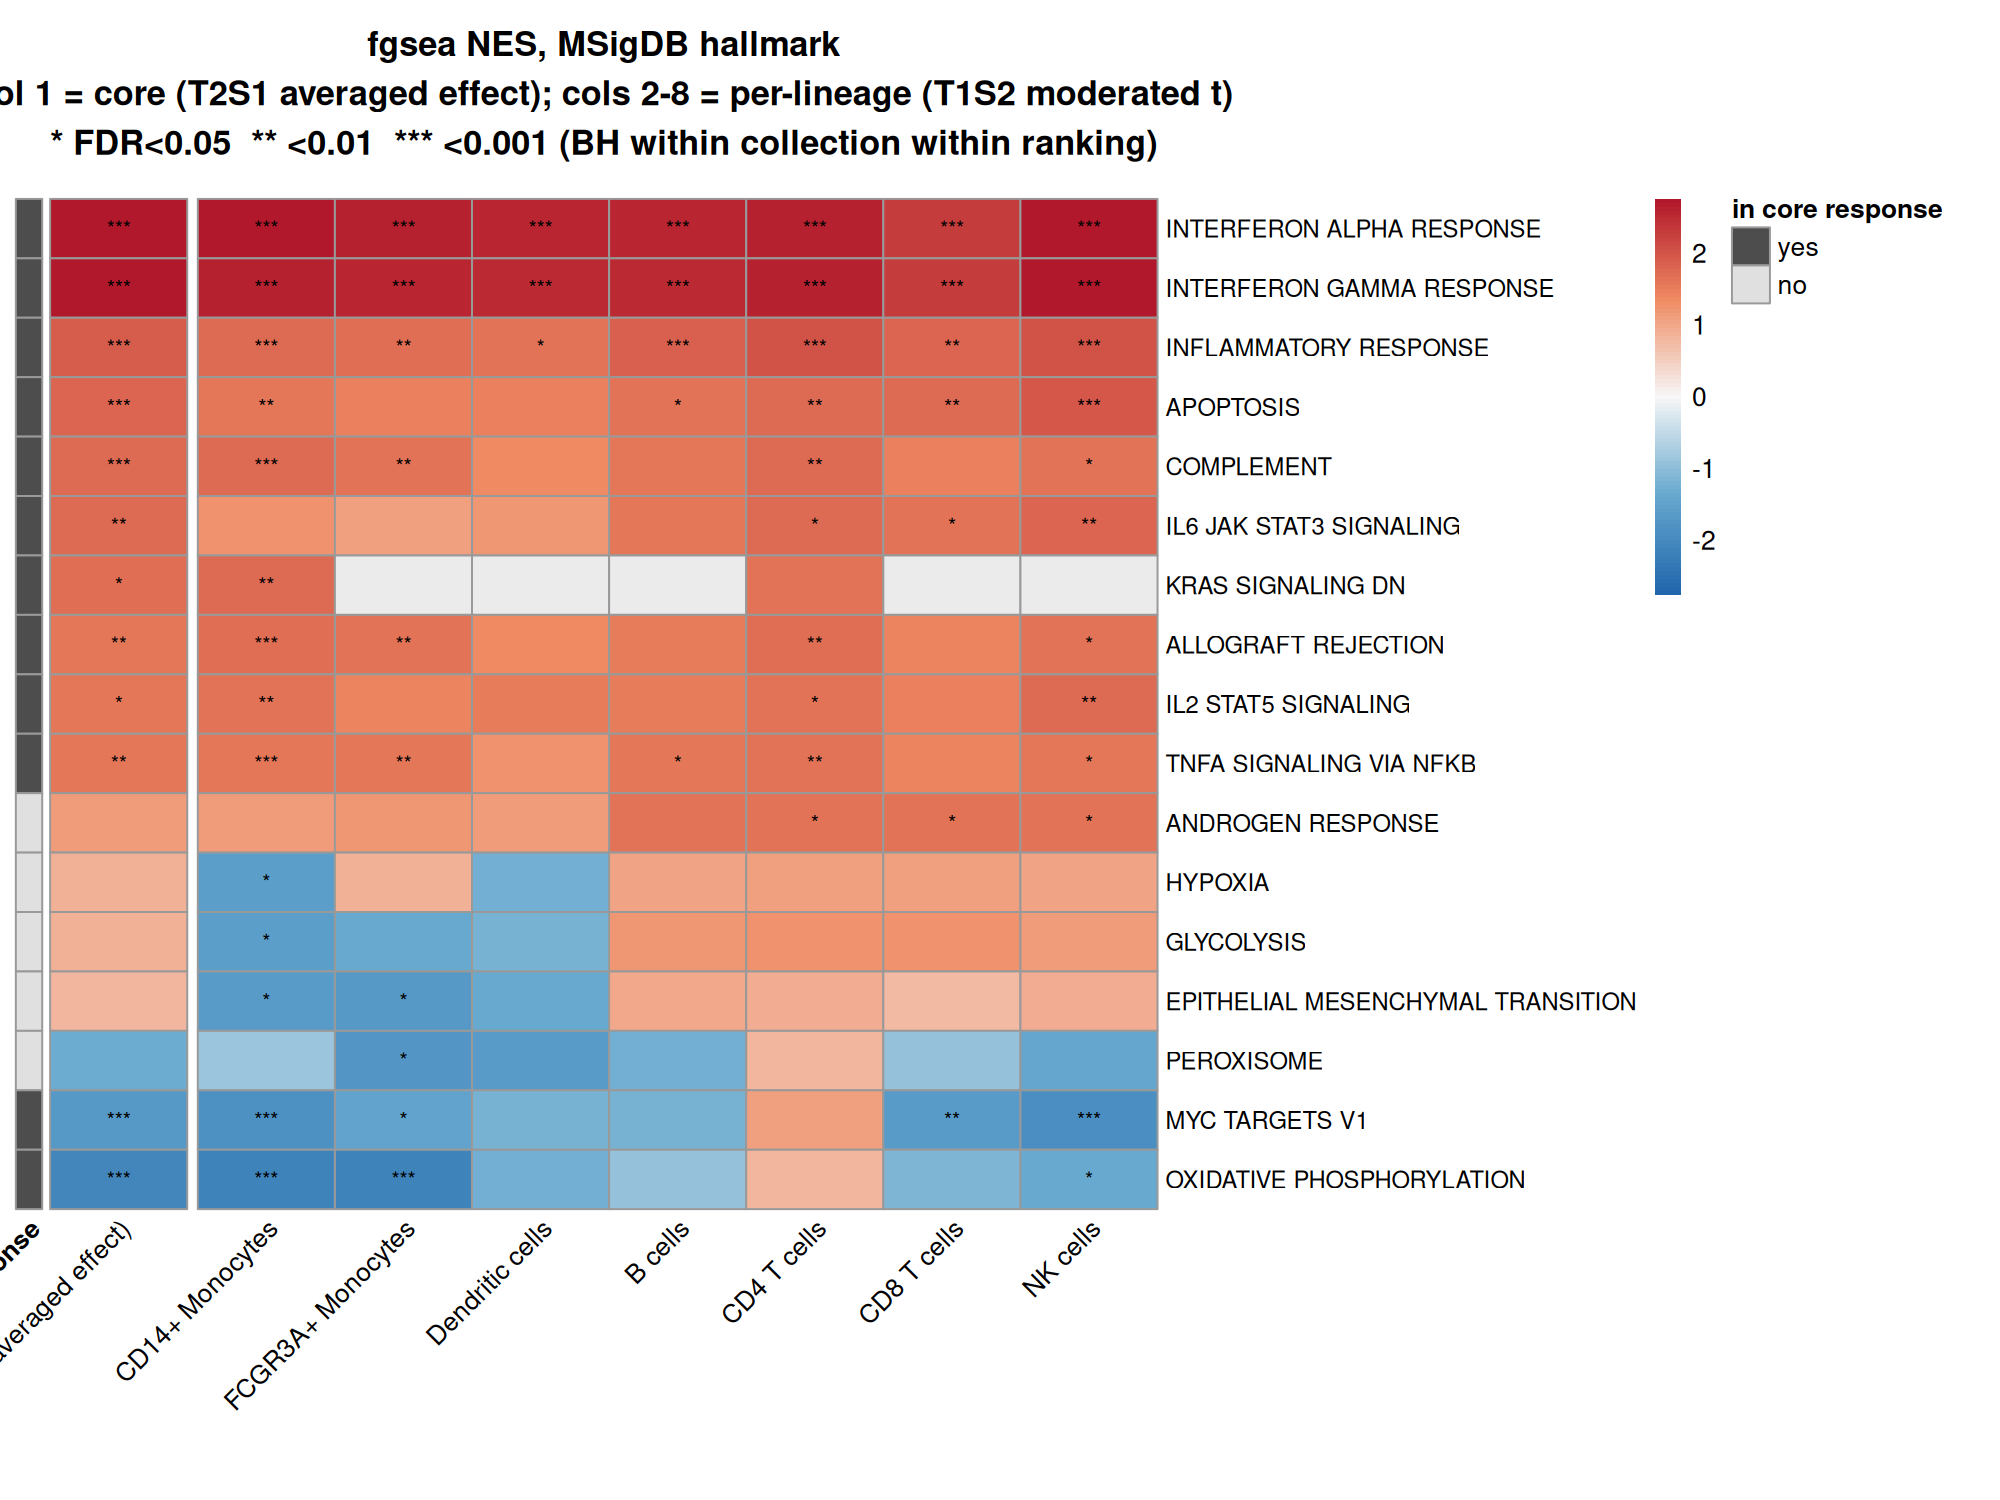
The interferon-alpha and interferon-gamma sets are the top two by enrichment score in all eight rankings, spanning just 2.29 to 2.76. Myeloid lineages suppress oxidative phosphorylation and MYC targets while mounting that response: CD14+ monocytes at NES -2.111 for OXPHOS, FCGR3A+ monocytes at -2.147. B cells' second-largest GO cluster is cytoplasmic translation, in the down direction. What individuates a lineage is what it gives up to respond, not which antiviral effectors it deploys.
The over-representation test makes the same point from the opposite direction, and this is the single most informative result in the step. The interferon sets are top-enriched in both the myeloid stronger-than-average foregrounds and the lymphoid weaker-than-average ones: FCGR3A+ monocytes' weaker set at odds ratio 55.2, NK cells' weaker set at 16.3, CD14+ monocytes' stronger set at 6.3. ISGs dominating both directions is the signature of one shared programme running at different gains.
Two pieces of hygiene are worth copying. GO biological process is a nested hierarchy, so the raw significant counts are not counts of processes: 1,570 raw hits collapse to 205 distinct ones under semantic clustering, an inflation factor of 5.8 to 8.9 across rankings. The step reports the collapsed numbers and says the raw ones overstate. And the enrichment background is the 4,274 symbols actually tested in the joint model, not the genome, with the 0.23% shrinkage from unmapped identifiers quantified rather than waved at.
HALLMARK_GLYCOLYSIS is enriched among the genes monocytes induce more strongly than average, at odds ratio 3.90 in FCGR3A+ monocytes and 2.52 in CD14+. On its own that reads as a glycolytic switch, and it is the kind of result a write-up would happily carry.
It is contradicted at the level that matters. Direct flux measurement in human macrophages shows IFN-β diminishes both oxygen consumption and glycolytic proton extrusion, and a mouse macrophage study reports that IFN-β restrains rather than promotes the glycolytic shift. The run states that the enrichment is a transcript-set observation on a small foreground and must not be read as a glycolytic switch. This is a real disagreement between computation and experiment, and it is reported as one. The OXPHOS and MYC half of the same result, by contrast, is well supported.
One more piece of housekeeping the step insists on: "weaker" means below the seven-lineage average, not downregulated. All seven lineages induce ISGs strongly. The high interferon odds ratios in the weaker foregrounds do not mean ISGs fall anywhere.
10. A second opinion, and a scale that lied
The last check is an independent one: score every pseudobulk library against the interferon hallmark set directly, with no model involved, and see whether the response and the ranking both reappear.
The response reappears unambiguously. All seven lineages induce the module, all 56 donor-lineage pairs are positive, every confidence interval excludes zero and the worst FDR across the seven is 1.8e-05. There are exactly 108 score rows for 108 analysed libraries, and no per-cell score was computed anywhere.
The ranking does not reappear, and that turns out to be the interesting part.
| Lineage | ISG panel | GSVA | GSVA rank | singscore | singscore rank |
|---|---|---|---|---|---|
| CD14+ Monocytes | 6.482 (1) | 1.157 | 1 | 0.302 | 4 |
| Dendritic cells | 5.550 (2) | 1.043 | 2 | 0.346 | 1 |
| CD4 T cells | 5.266 (3) | 0.921 | 4 | 0.310 | 3 |
| B cells | 5.262 (4) | 0.990 | 3 | 0.319 | 2 |
| FCGR3A+ Monocytes | 4.702 (5) | 0.883 | 6 | 0.237 | 7 |
| CD8 T cells | 4.434 (6) | 0.838 | 7 | 0.275 | 5 |
| NK cells | 4.291 (7) | 0.903 | 5 | 0.275 | 6 |
GSVA agrees with the model-based ranking at Spearman 0.857, recovering both the top-1 and the top-2. singscore, on the identical matrix and the identical gene set, agrees at only 0.643 and disagrees on both. Two rank-based scoring methods, same input, different answer.
The step diagnoses this rather than picking the one it likes. singscore's paired difference correlates negatively with the control baseline (Spearman -0.464); GSVA's does not (+0.107). CD14+ monocytes start from a high control baseline with the second-lowest headroom on a bounded scale, and they nonetheless reach the highest stimulated score of any lineage, 0.3958 against a range of 0.2400 to 0.3769. They end furthest along and travel a shorter distance, and singscore reports the distance.
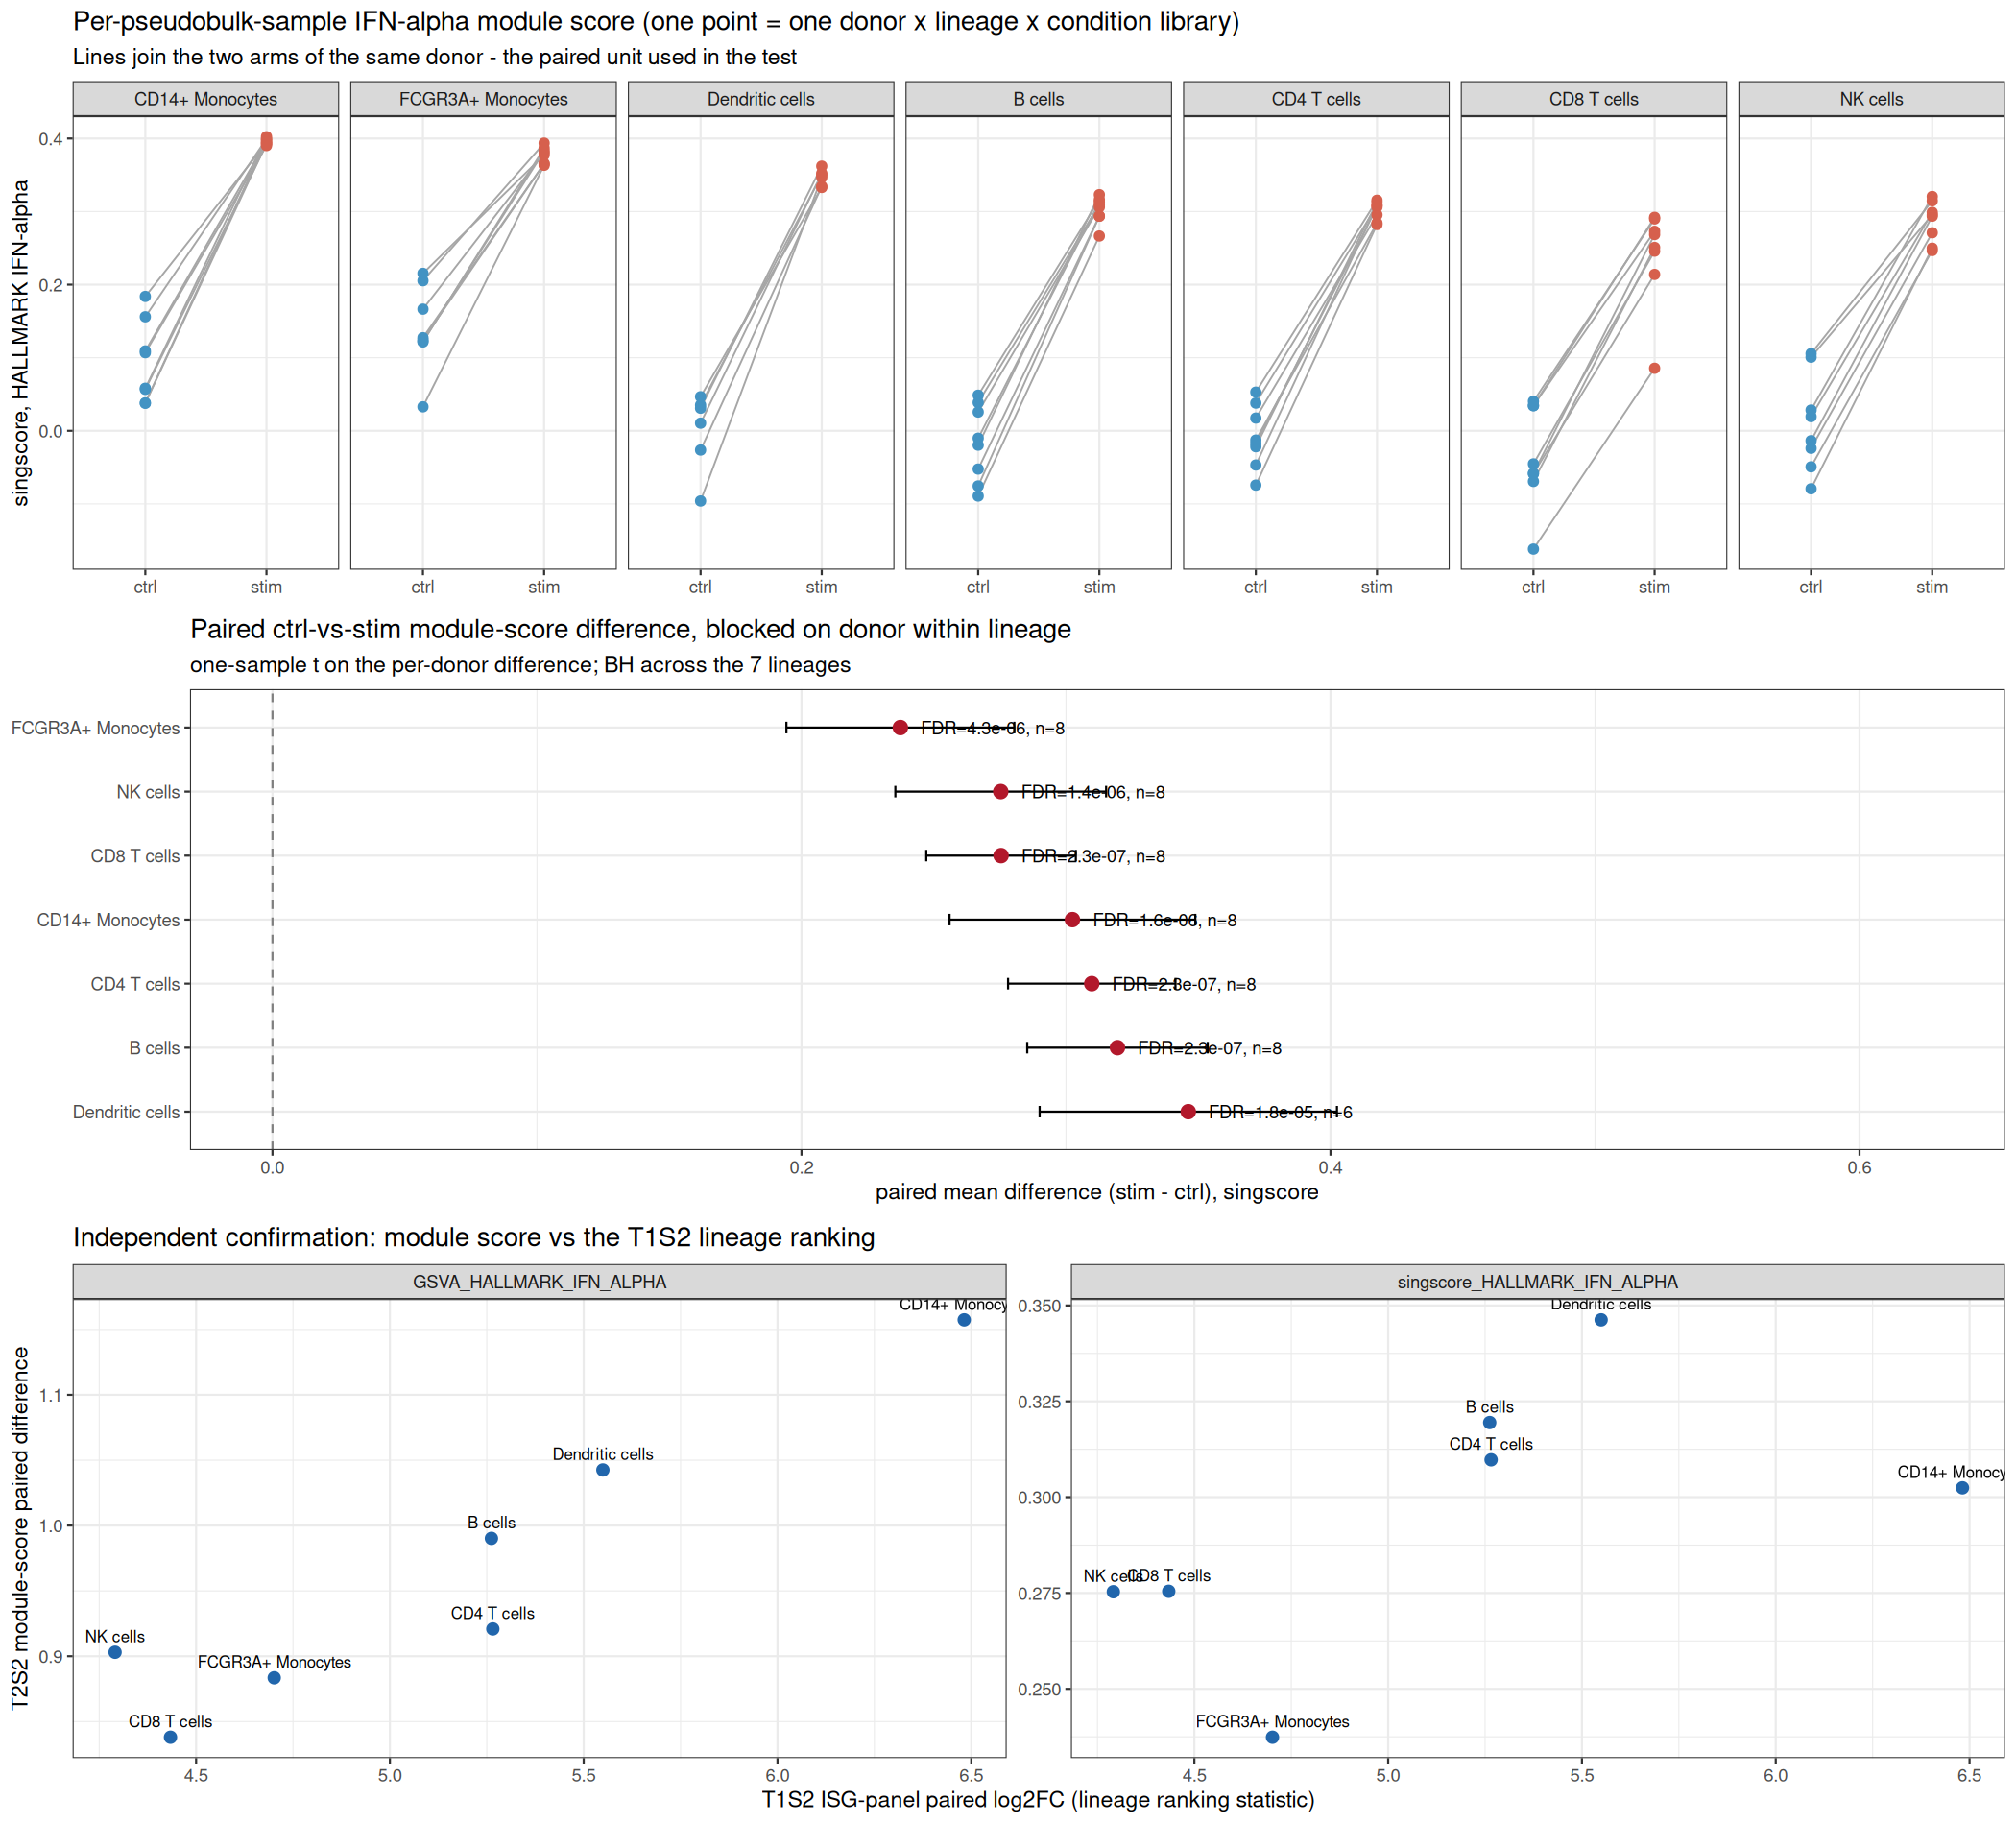
The instruction the step leaves behind is specific: do not report the singscore rank order as an independent lineage ranking, because it is scale-confounded. Report GSVA's, or better, report only the CD14+ monocyte and dendritic cell top-2 claim that all three statistics agree on.
The same bounded-scale logic recurs one section earlier. In the interaction model, 63% to 68% of the myeloid weaker-than-average calls occur where that monocyte subset already holds the highest control baseline. It is the same ceiling appearing in two unrelated statistics, and noticing that is what turns a methodological annoyance into a finding.
The verdict
On the biology, three mutually independent statistics converge on one axis. A within-donor ISG-panel effect size ranks CD14+ monocytes first and dendritic cells second, and holds that ordering when every unit is cut to 15 cells. A coefficient-equality test in a joint model, which never sees the panel, produces a myeloid-stronger and lymphoid-weaker split in the direction of every significant interaction contrast. GSVA on the raw libraries reproduces the same top two. The interferon programme is qualitatively shared and quantitatively tuned.
The direction of that ranking is confirmatory, and the run says so: pSTAT1 flow cytometry in fresh human blood and microarray on purified subsets already place monocytes at the top of the IFN-β response. What this run contributes is the scale: an effect size with a confidence interval, shown robust to equalising cell number, plus a demonstration of why the naive scale fails.
The interaction result is where the run claims something new. No prior cell-type × condition interaction model on donor-paired human PBMC interferon data was found in the literature search, so the 61-versus-1,906 split is offered as a new quantitative result. Its architecture is exactly what chromatin work predicts. STAT1/2 binding and ISG inducibility track pre-existing enhancer accessibility, which is why interaction terms should dominate. The numerical echo of the 62-gene conserved ISG core reported across species is flagged as an analogy on a different axis, not a replication.
Everything on this page rests on 108 verification checks across the five steps, all of which pass, and several of which are the reason a claim on this page is narrower than it could have been. The averaged-effect coefficient is reproduced by an independent weighted-least-squares refit to 6e-14; the multiple-testing families are re-derived from scratch and agree to 2e-15; the class partition is confirmed exhaustive and exclusive with no overlap at the FDR boundary.
Plenty stays uncertain, and the run says which parts. 1,906 is a floor on lineage specificity because the joint model cannot see lineage-restricted genes. 6.40% of genes change class on the choice of F statistic. Dendritic cells rest on six donor pairs. The glycolysis enrichment contradicts published flux data and is reported as contradicted. And the number that bounds all of it does not move: eight donors, six for dendritic cells, no matter how many cells were sequenced.
If you run this yourself, those are the numbers to compare against. A run that puts CD14+ monocytes first on a depth-independent scale, finds the core far smaller than the interaction, and tells you its mitochondrial filter did nothing, is working. A run that reports vanishing p-values off the back of tens of thousands of cells has tested cells instead of people.
What is still open
Four of the run's stated limitations are worth more than a footnote. They are the honest to-do list, each with the thing it would take to settle it:
- The lineage-restricted genes nobody tested. Requiring a coefficient estimable in all seven lineages cut the interaction test to 4,284 of 35,635 genes. Settling how much lineage specificity lives outside that window needs a different design: pairwise fits, or a model that tolerates non-estimability. A re-analysis of these files will not get there.
- Whether SSB moves at the protein level. This is mRNA at six hours with a single non-haematopoietic precedent behind it. Protein-level confirmation in sorted myeloid cells is the next experiment, and it is an experiment, not a computation.
- The glycolysis disagreement. Transcript-set enrichment says one thing and direct flux measurement in human macrophages says the opposite. Nothing in this dataset can adjudicate that; a Seahorse assay can.
- Everything that needed a clinical covariate. No age, sex, disease activity, autoantibody titre or treatment ships with GSE96583, so the monocyte-resolved stratification idea and the SSB mechanism cannot be tested against outcome inside this run at all. That is a limit of the deposit, not of the analysis.
None of them were attempted. The session was scoped to one question and stopped where the evidence stopped, which is also why the write-up can be specific about what it does not know.
The full report, and the data package
This page is the walkthrough. The report carries the argument at full length, and the package carries every file behind it, so that you do not have to take the write-up on trust.
The report was generated from the same run, and the structure it chose is itself worth a look: the ranking section leads with why DE counts are an unusable scale before it shows any ranking, the module-score divergence is placed as a validation subsection rather than as standalone methodology, and every caveat sits beside the claim it qualifies instead of being pooled into a list at the end.
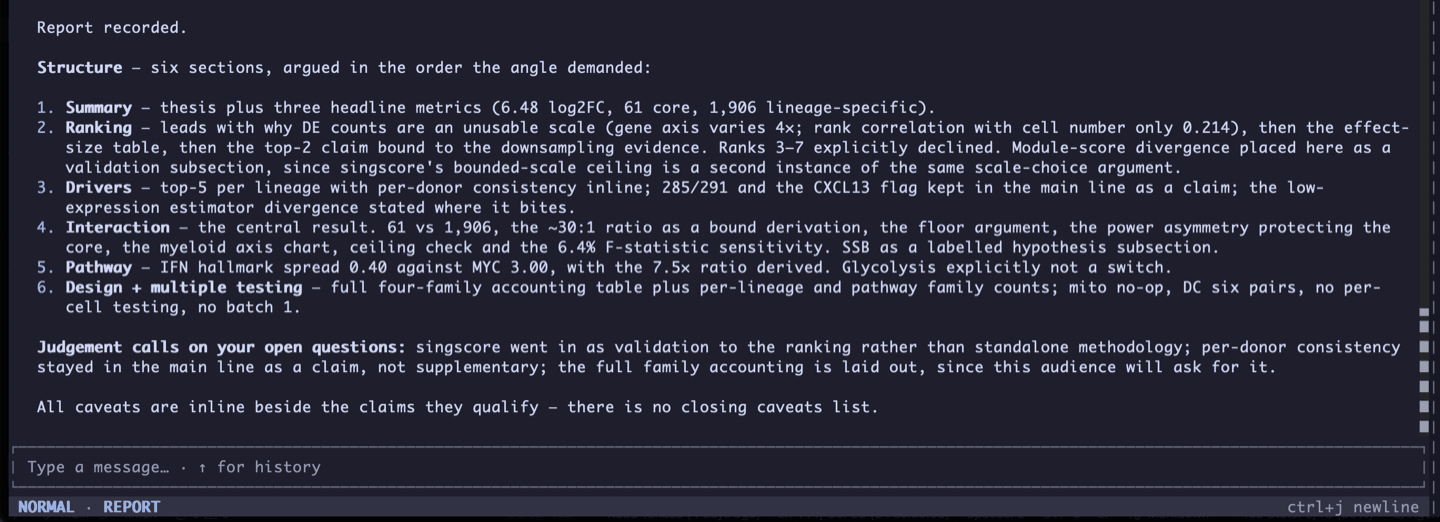
The generated report
"Universal in kind, myeloid-amplified in degree: the IFN-β response of human PBMCs, lineage by lineage". Six sections, every figure, every table with its data downloadable, the full four-family multiple-testing accounting, and the references behind every literature claim on this page. It is the document this page was written from.
The report ships as a self-contained HTML file inside the Zenodo package below. Open it in a browser after downloading.
The data package
Inputs, the R and Python scripts as they were generated and run, every log, every output table, and the five verification-check files, archived on Zenodo with a DOI. Enough to reproduce the run without this page, or to check any number on it.
10.5281/zenodo.22212511Your turn
Repeating this run is the boring version. Point the same question at your own stimulation or perturbation experiment and the prompt barely changes, because the shape of it matters more than the wording:
I'm interested in what [your perturbation] is actually doing to these cells, cell type by cell type. Which [lineages / clusters] respond hardest, through which genes, and what's shared across all of them versus specific to one. [State the pairing: which samples are the same subject in both arms.] I need statistics I can defend to a reviewer.
Three habits from this run transfer to any single-cell dataset.
State the pairing in the prompt, because it is the one fact about your design that the files cannot tell you and it changes every model downstream. Ask for a standard rather than a method. "Defend to a reviewer" is what produced the ban on per-cell tests, the interaction test and the depth-independent ranking, and none of those three were named. And when two ways of measuring the same thing disagree, treat the disagreement as the result: the singscore and GSVA split on this run was worth more than either ranking on its own.
If you want to start with this exact dataset, it is nine files and 74.4 MB, and the first prompt is on this page.
Run this on your own data.
Inflexa is free and open source under Apache 2.0. It runs on your machine, with the model you choose, and every result carries a record of how it was made.